Method for analytically obtaining closed form expressions for subsurface temperature dept distribution along with its error bounds
a technology of subsurface temperature and error bounds, applied in the direction of seismology, instruments, waterlogging, etc., can solve the problems of uncertainty in the estimation of geothermal parameters, bound uncertainty,
- Summary
- Abstract
- Description
- Claims
- Application Information
AI Technical Summary
Benefits of technology
Problems solved by technology
Method used
Image
Examples
example 1
[0057]Numerical values of the controlling input thermal parameters for a Realistic Earth model for condition 1
[0058]
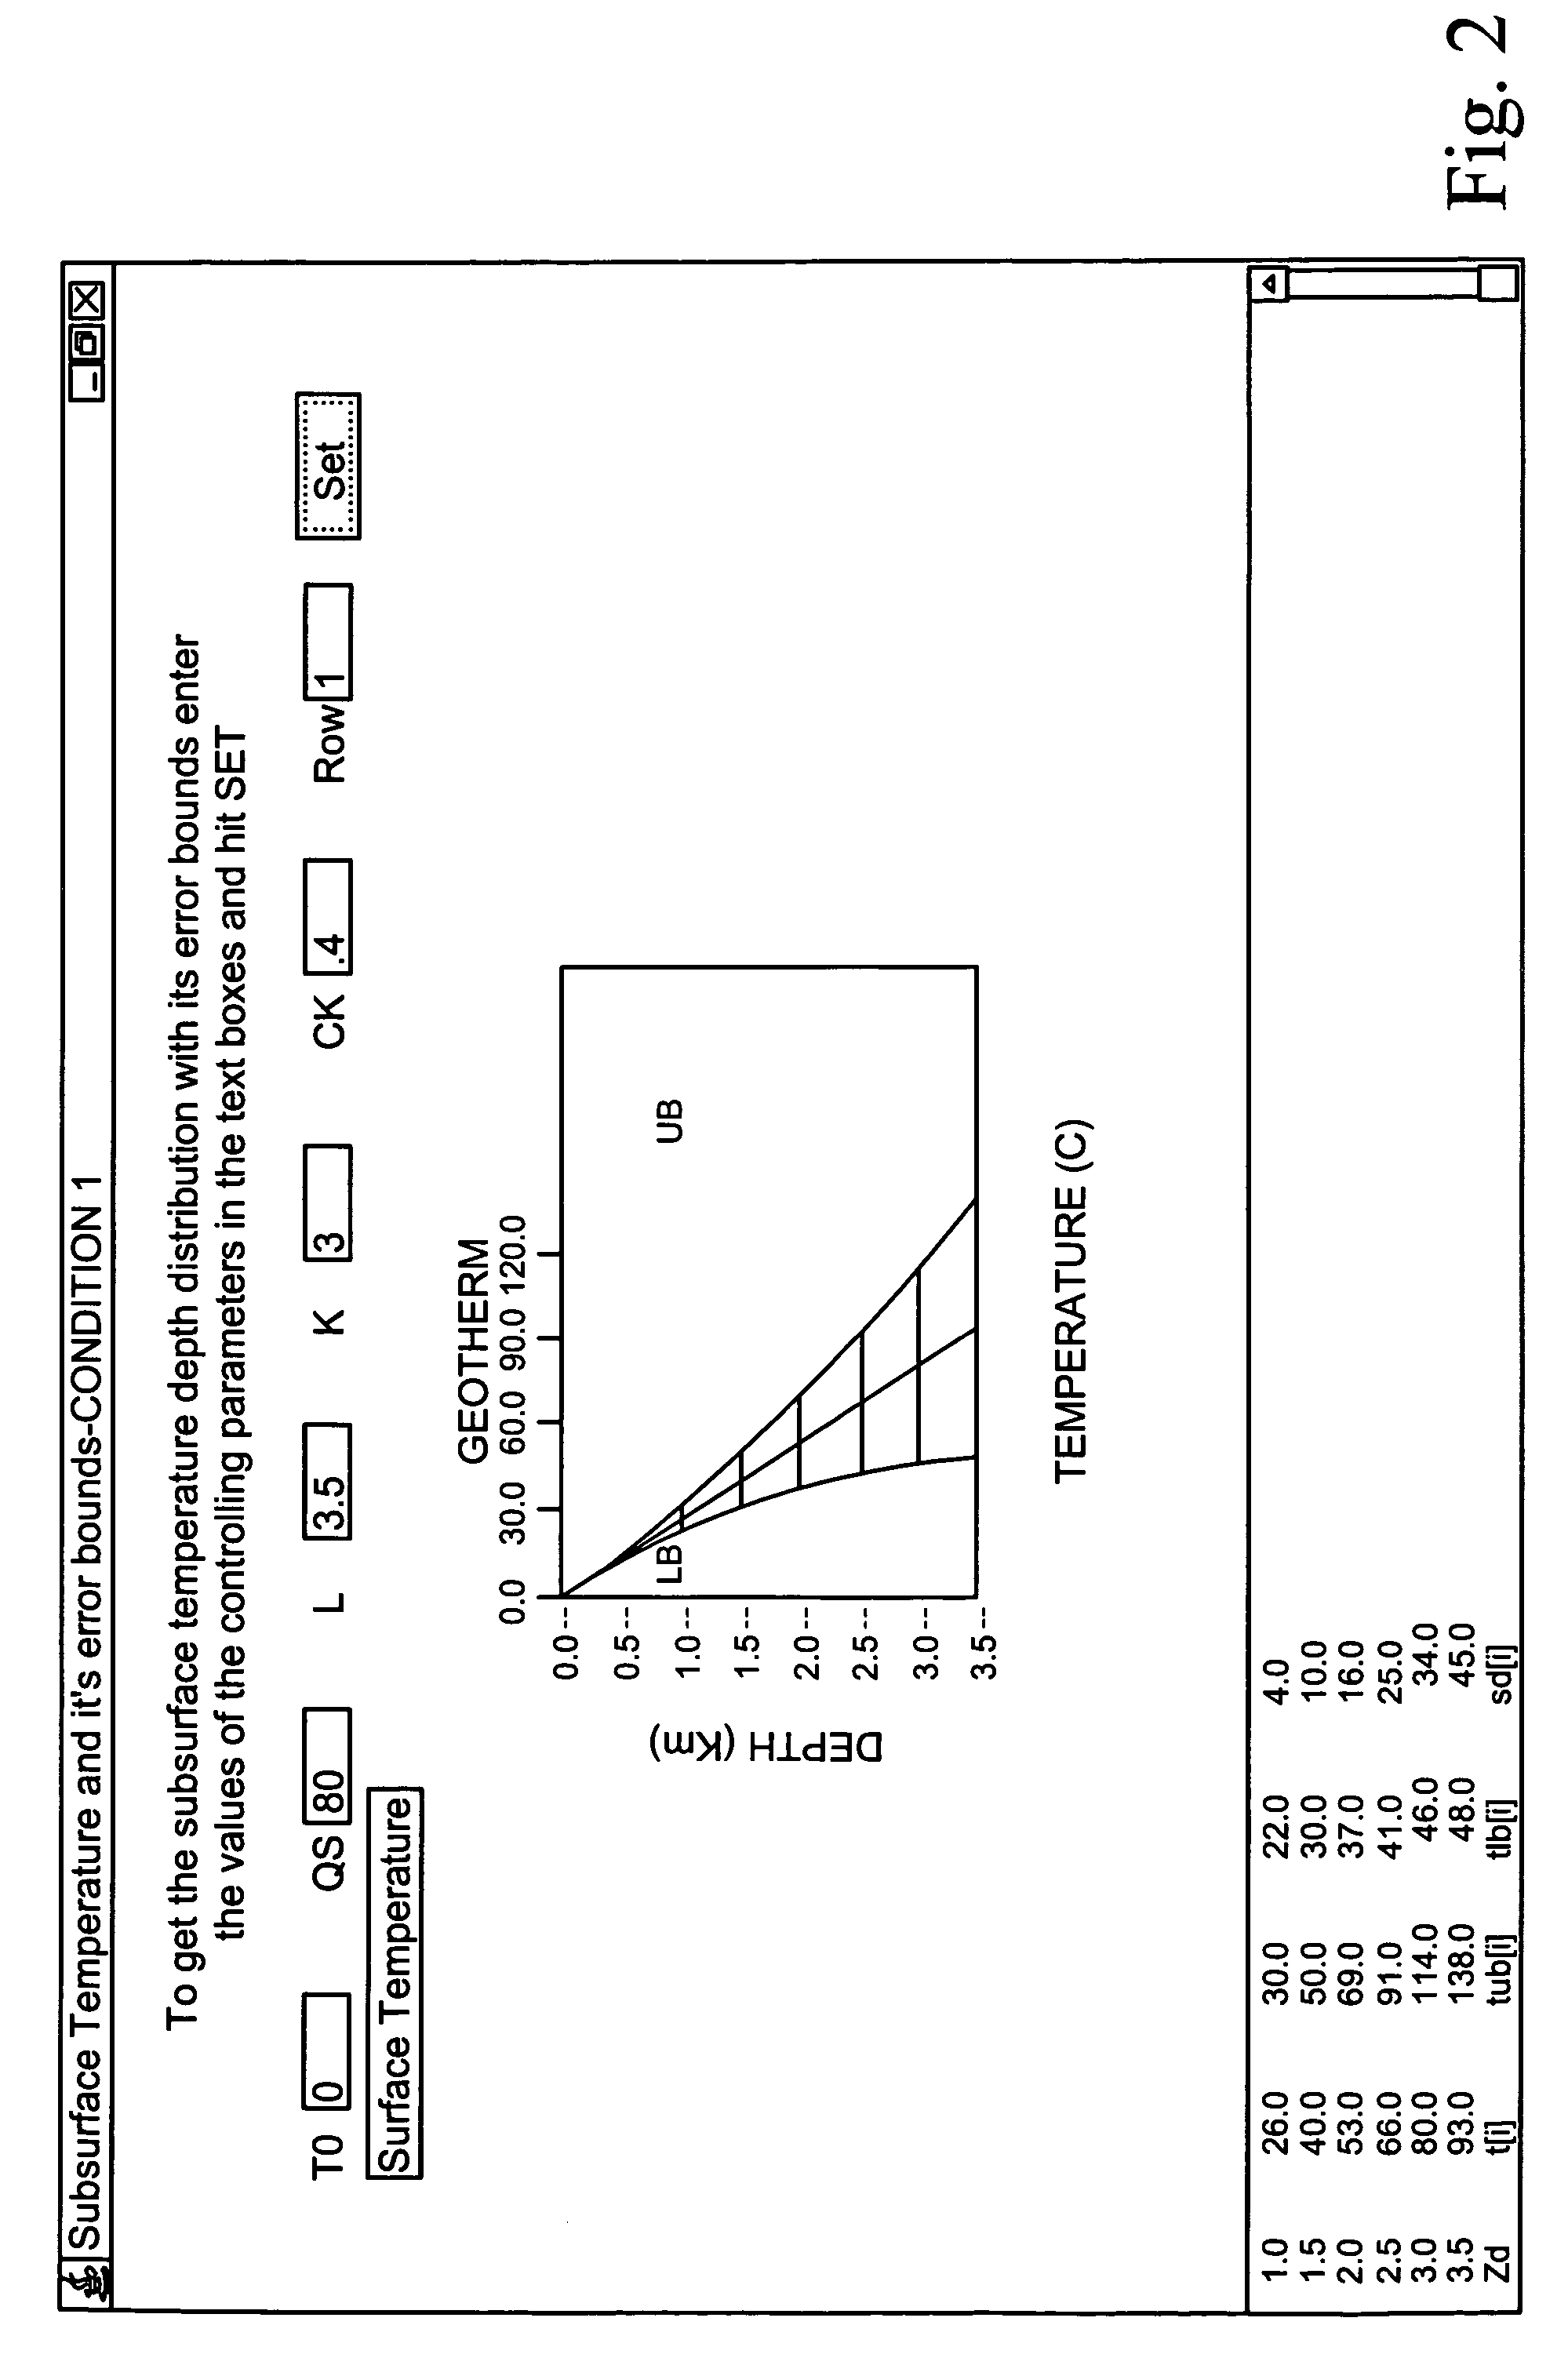
Boundary conditions:Surface Temperature (T0) 0 (° C.)Surface heat flow (Qs) 80 (mW / m2)Model Depth (L).3.5 (km)Random thermal conductivity:Mean thermal conductivity {overscore (K)}3.0 (mW / m2)Coefficient of variability Ck0.4Correlation length scale 1 / ρ 1 km
[0059]Using these controlling thermal parameters the mean temperature and its error bounds have been computed using equations (9) and (10) and the results have been plotted in FIG. 1. From the figures we see that the error bounds on the temperature increases with depth, increases with an increase in the coefficient of variability in thermal conductivity and in the correlation length scale
example 2
[0060]Numerical values of the controlling input thermal parameters for a Realistic Earth model for condition 2
[0061]
Boundary conditions:Surface Temperature (T0) 0 (° C.)Basal heat flow (QB) 30 (mW / m2)Model Depth (L).5.5 (km)Random thermal conductivity:Mean thermal conductivity {overscore (K)}2.0 (mW / m2)Coefficient of variability Ck0.3Correlation length scale 1 / ρ 1 km
[0062]Using these controlling thermal parameters the mean temperature and its error bounds have been computed using equations (12) and (13) and the results have been plotted in FIG. 2. From the figures we see that the error bounds on the temperature increases with depth, increases with an increase in the coefficient of variability in thermal conductivity and in the correlation length scale
example 3
[0063]Numerical values of the controlling input thermal parameters for a Realistic Earth model for condition 3
[0064]
Boundary conditions:Surface Temperature (T0) 30 (° C.)Surface heat flow (Qs) 40 (mW / m2)Heat SourceRadiogenic heat production (A)2.5 (μW / m3)Model Depth (L). 10 (km)Random thermal conductivity:Mean thermal conductivity {overscore (K)}3.0 (mW / m2)Coefficient of variability Ck0.2Correlation length scale 1 / ρ 3 km
[0065]Using these controlling thermal parameters the mean temperature and its error bounds have been computed using equations (15) and (16) and the results have been plotted in FIG. 3. From the figures we see that the error bounds on the temperature increases with depth, increases with an increase in the coefficient of variability in thermal conductivity and in the correlation length scale.
PUM
| Property | Measurement | Unit |
|---|---|---|
| temperature | aaaaa | aaaaa |
| temperature | aaaaa | aaaaa |
| temperature | aaaaa | aaaaa |
Abstract
Description
Claims
Application Information
 - R&D
- Intellectual Property
- Life Sciences
- Materials
- Tech Scout
- Unparalleled Data Quality
- Higher Quality Content
- 60% Fewer Hallucinations
Browse by: Latest US Patents, China's latest patents, Technical Efficacy Thesaurus, Application Domain, Technology Topic, Popular Technical Reports.
© 2025 PatSnap. All rights reserved.Legal|Privacy policy|Modern Slavery Act Transparency Statement|Sitemap|About US| Contact US: help@patsnap.com


