Electromagnetic surveying for hydrocarbon reservoirs

a hydrocarbon reservoir and electromagnetic technology, applied in the field of controlled source electromagnetic, can solve the problems of time-consuming and laborious surveying process, limited useful data, and inability to provide data amenable to conventional geophysical inversion analysis techniques, and achieve the effect of easy generation

Active Publication Date: 2007-03-13
PGS GEOPHYSICAL AS
View PDF6 Cites 81 Cited by
  • Summary
  • Abstract
  • Description
  • Claims
  • Application Information

AI Technical Summary

Benefits of technology

[0009]By applying a wavefield extrapolation to CSEM survey data it is possible to accurately reconstruct variations in electrical properties within the subterranean strata. This can be done much more quickly than conventional inversion analysis. For example, the method can provide a readily interpretable representation of the variation in scattering coefficient within the subterranean strata in a number of minutes for a typical data set. This compares to an inversion analysis which might take several days to complete. This means, for example, that the output map can be displayed to an operator of a CSEM survey as an easily interpretable image in what is in effect almost real time.
[0011]The method may be applied to data collected for arbitrary source and receiver geometries. This allows, for example, useful data to be collected for all locations of a source being towed along an arbitrary path over an array of receivers. There is no requirement for particular survey geometries to be adopted of the kind required for conventional inversion analysis. This reduces the time (and expense) required to perform surveys and provides for much more efficient collection of useful data.
[0023]At least one of the discrete frequencies may be a harmonic of another of the discrete frequencies. This type of harmonic relationship allows multiple frequency components to be relatively easily generated from a single source.

Problems solved by technology
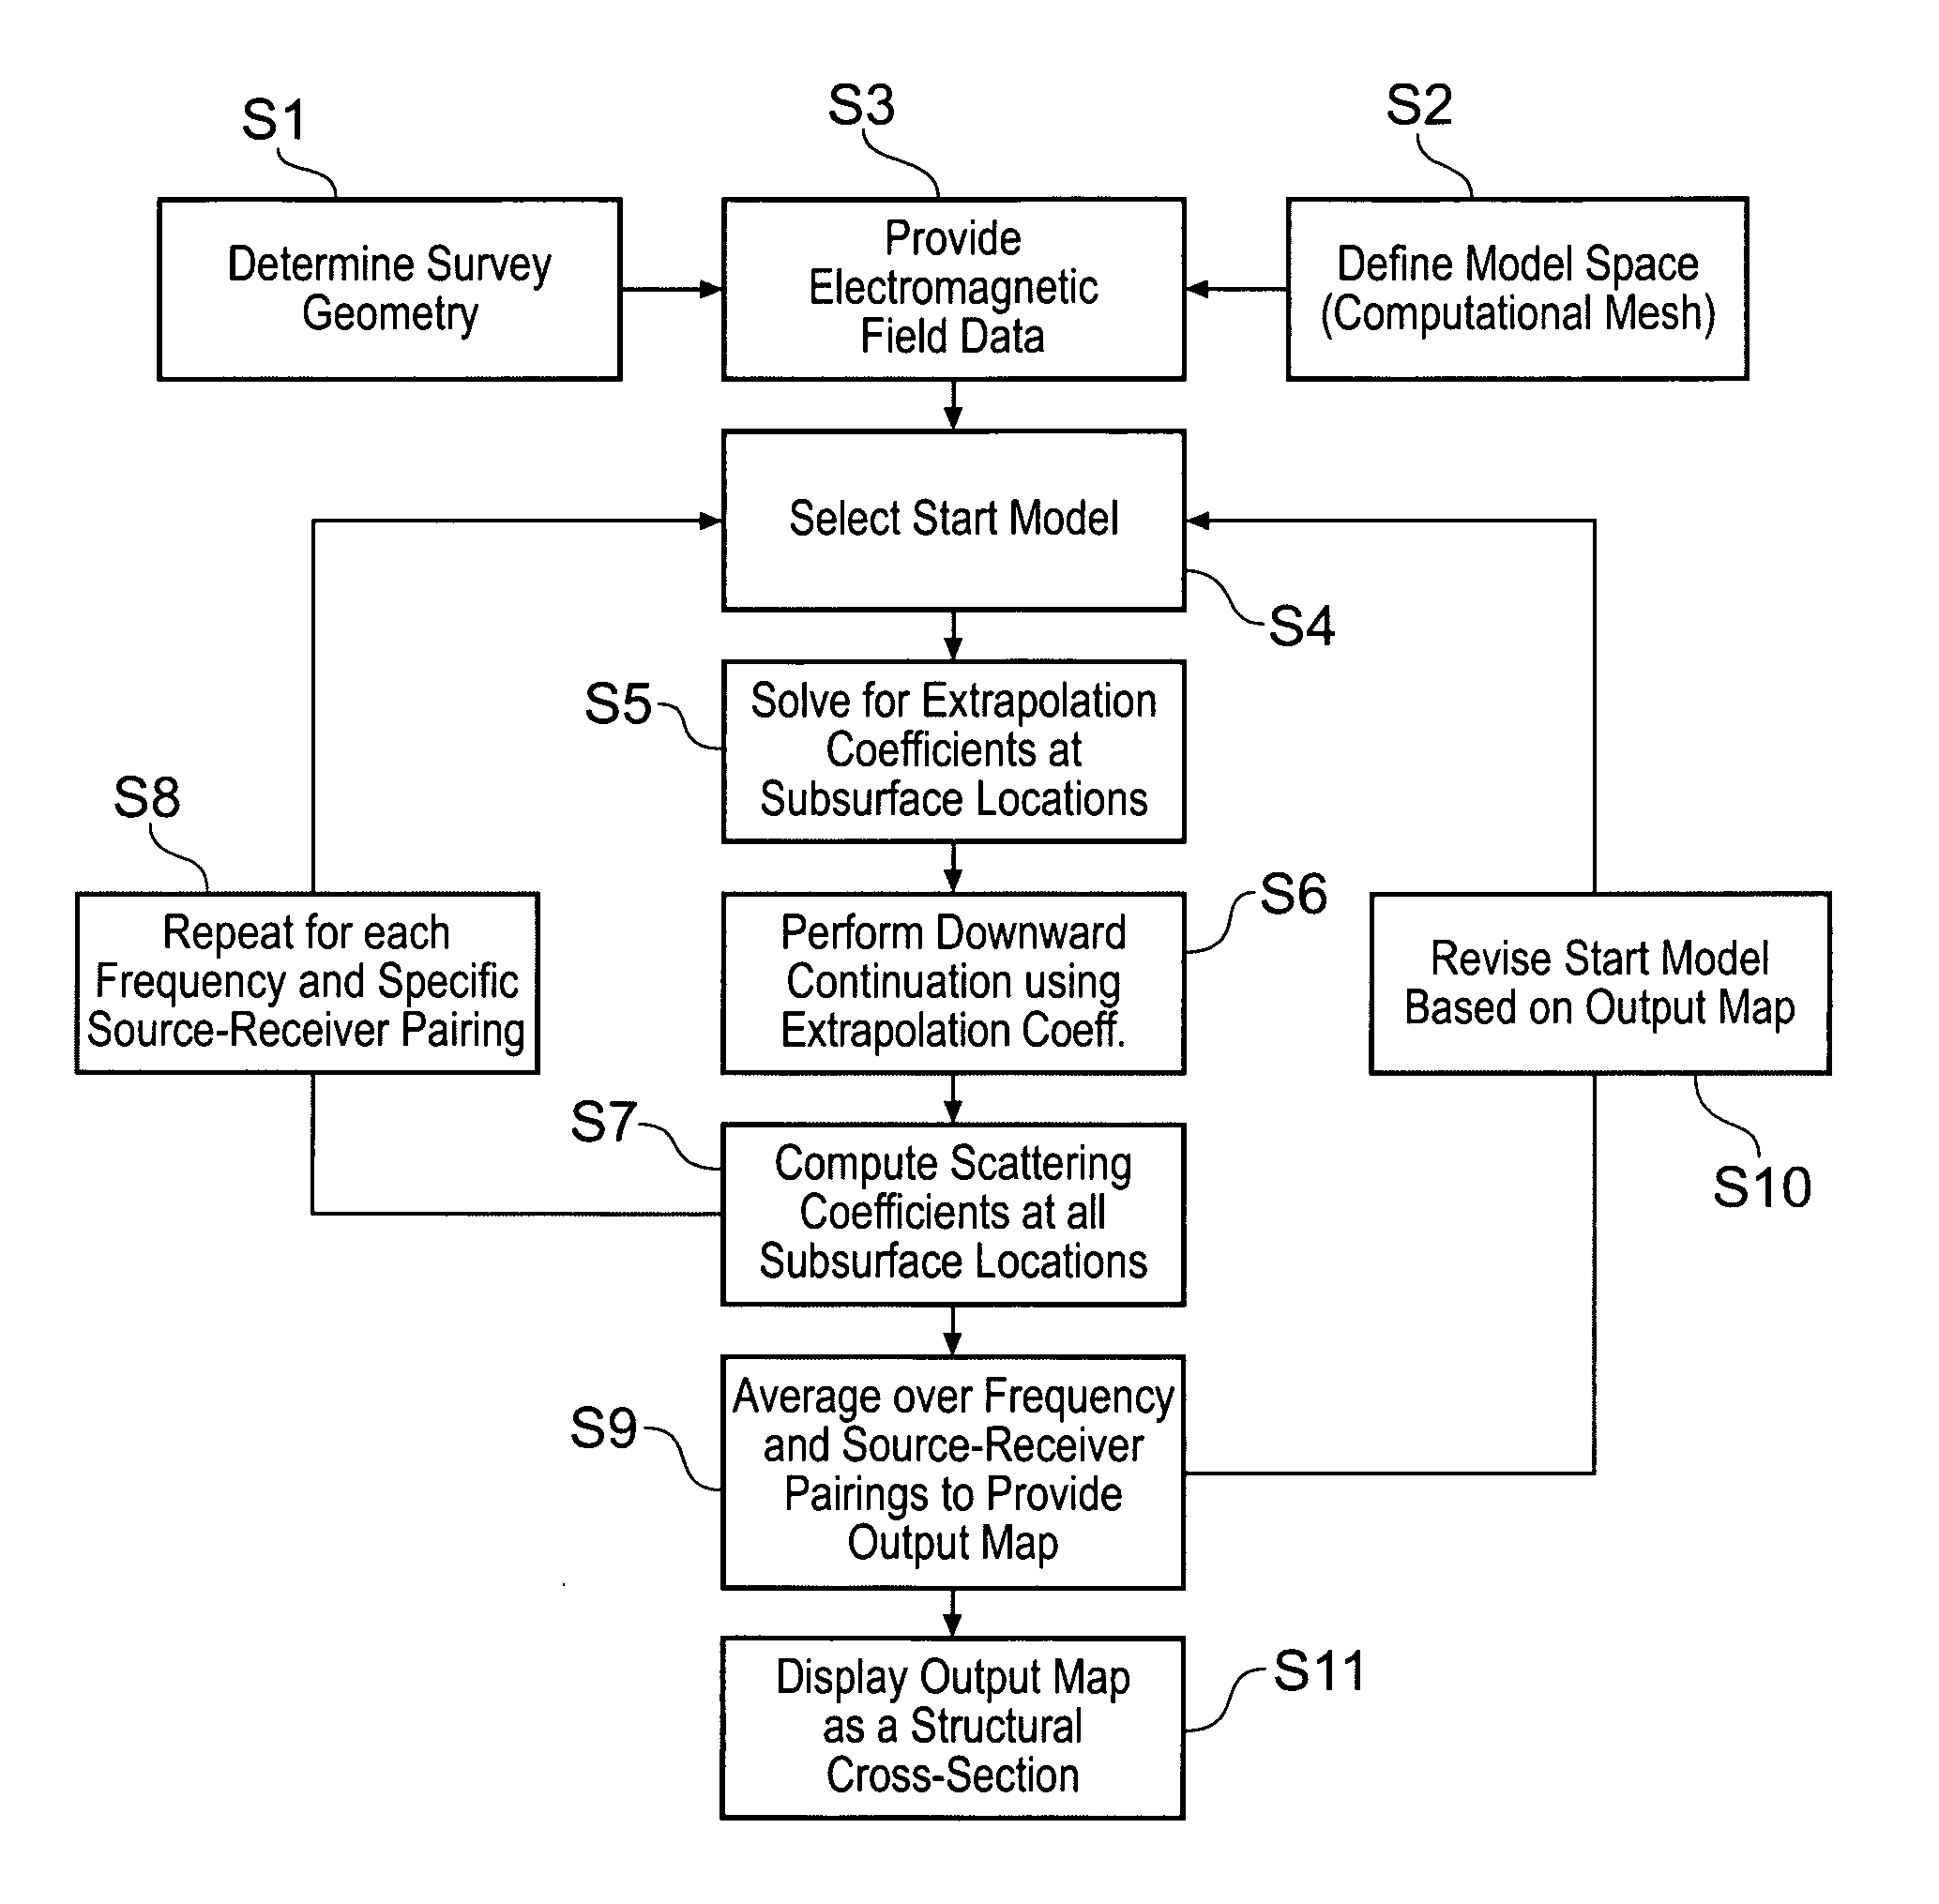
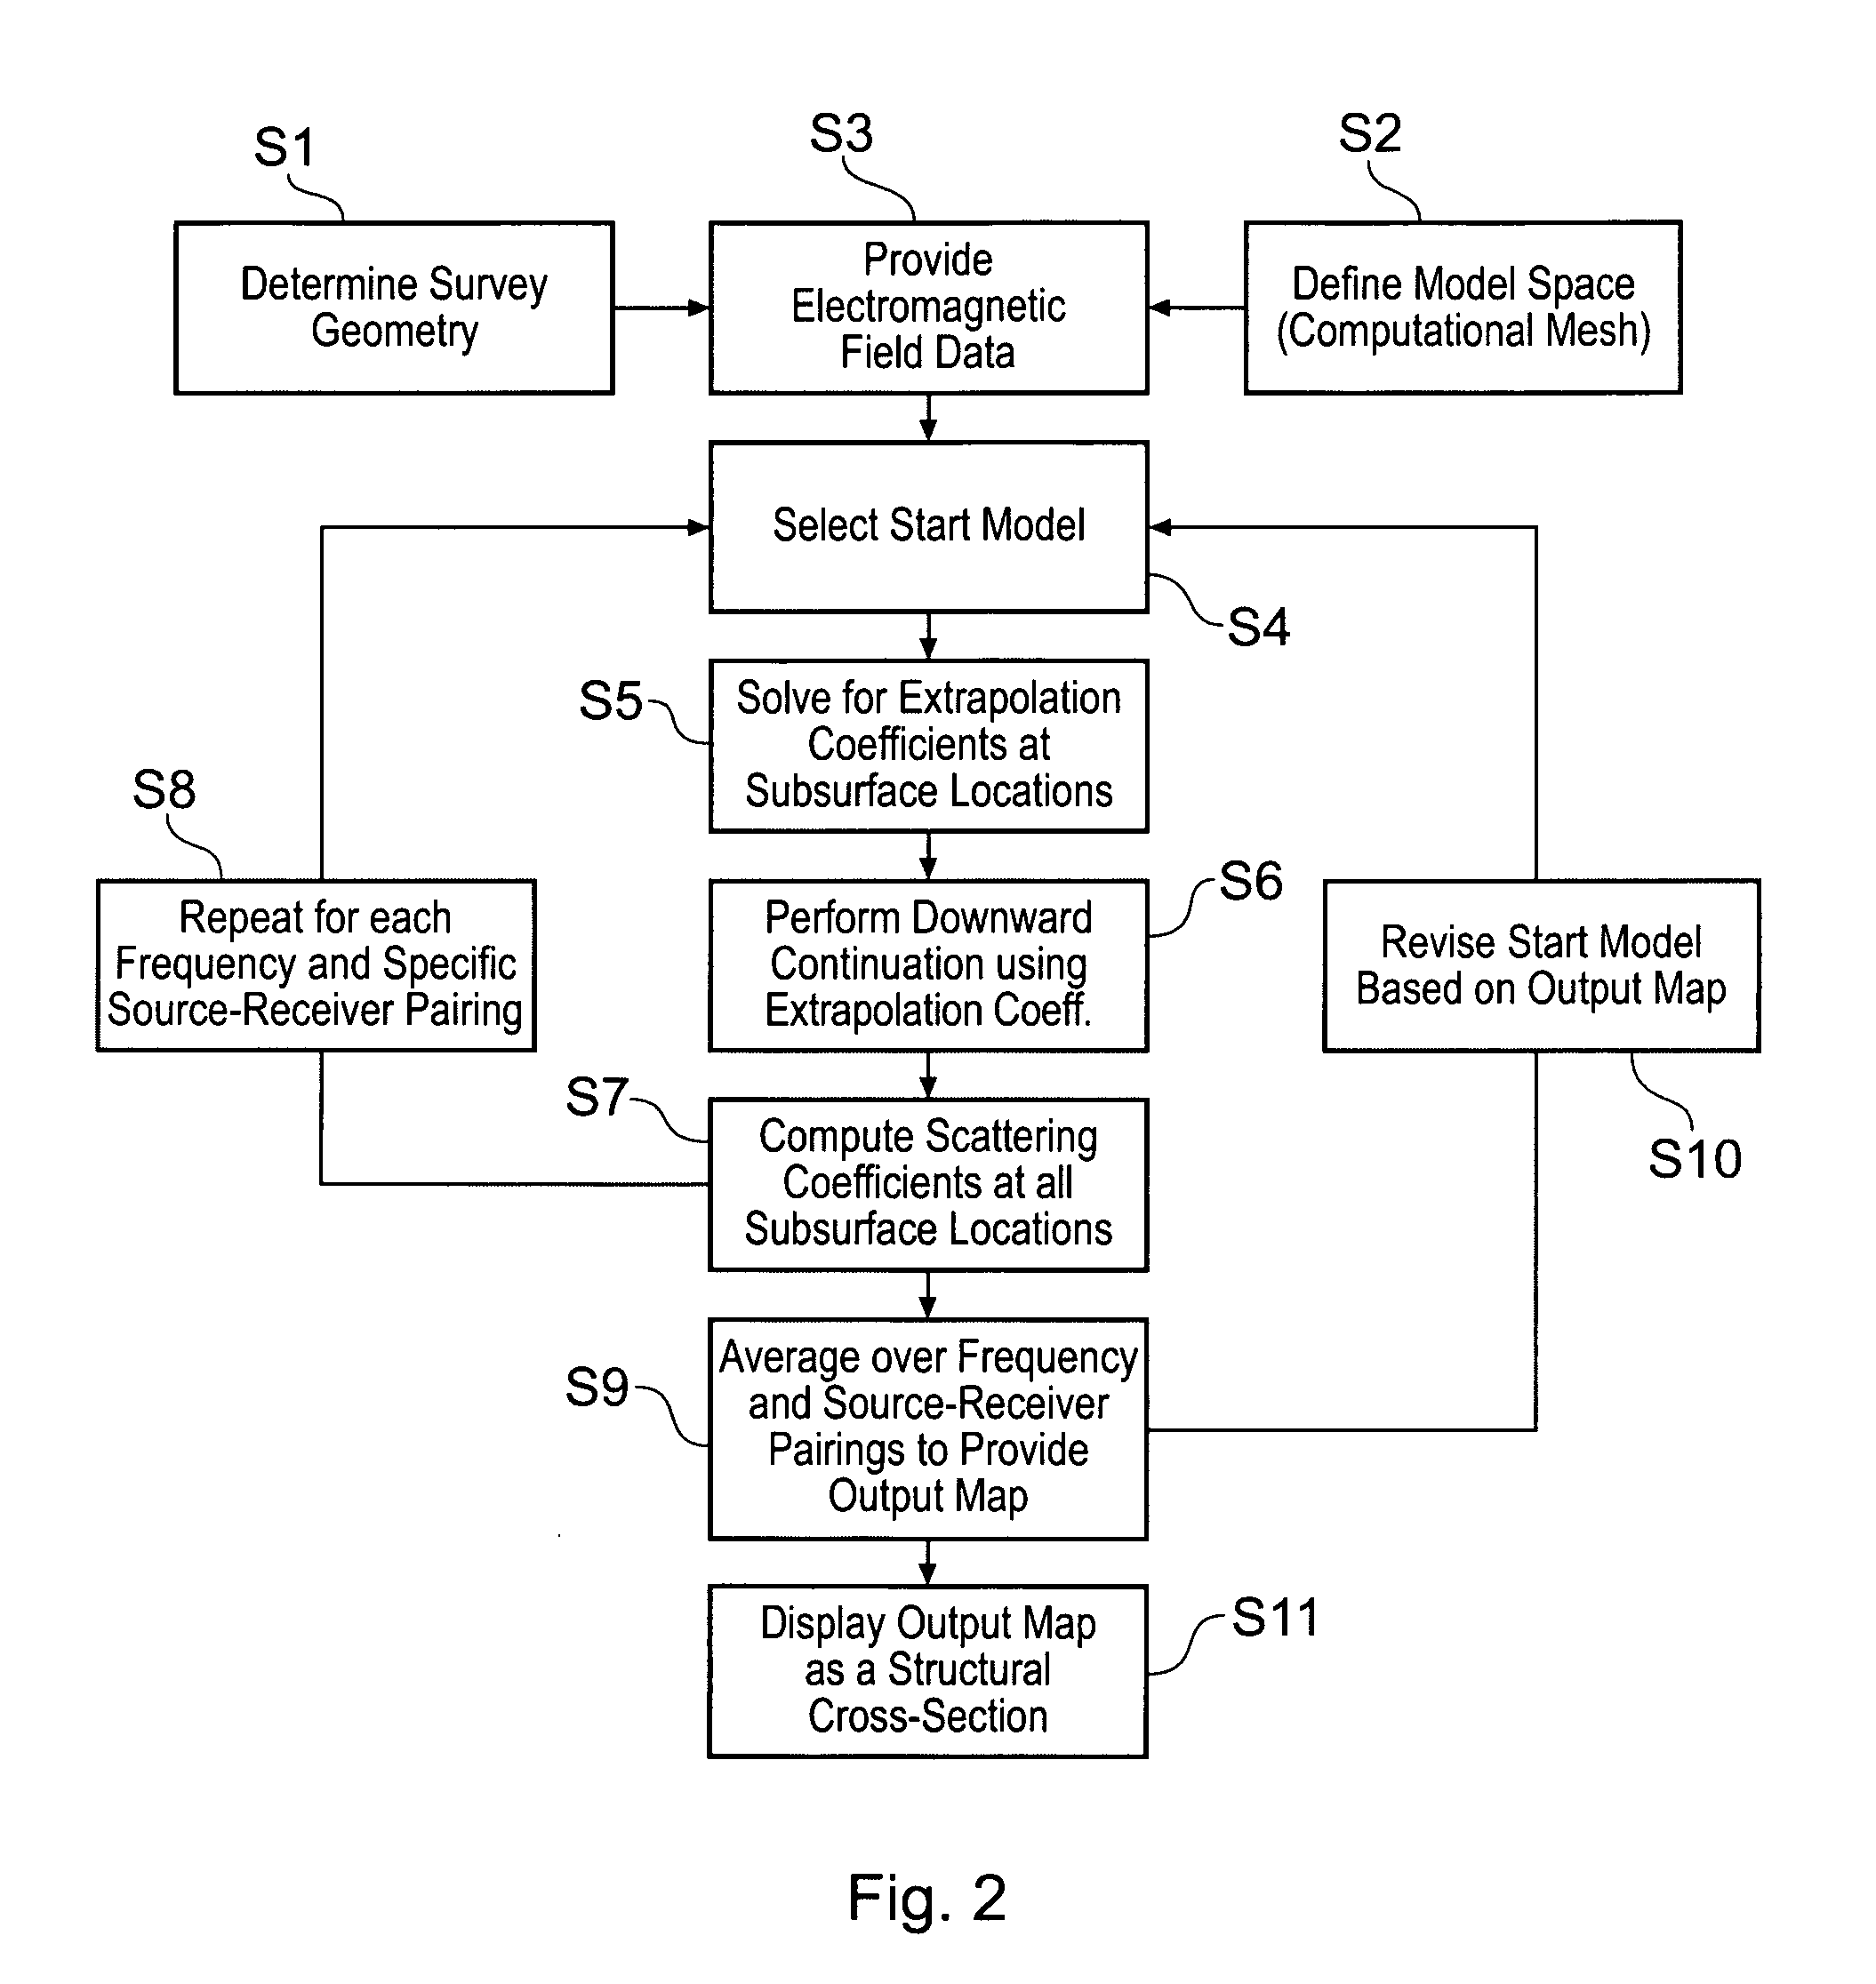
Although CSEM surveys can provide a valuable insight into the electrical properties of subterranean strata, conventional CSEM surveying and data analysis techniques are subject to a number of limitations.
The requirement for data to be collected for a number of particular source-receiver geometries imposes restrictions on how much useful data can be collected during towing of an EM source over an array of receivers.
Furthermore, since CSEM surveys are often performed by towing a single EM source over an array of receivers multiple times to provide data for different source-receiver orientations, the surveying process for providing data which are amenable to conventional geophysical inversion analysis techniques can be time consuming.
A further limitation of conventional CSEM surveying and data analysis techniques is that they do not quickly provide an easily interpretable output representing the electrical properties of subterranean strata beneath a survey area.
This means it can be difficult to react to survey results in real time, for example, to focus on a region which may potentially be of particular interest within a larger area.
Although this process can result in accurate subterranean models, the timing and computations necessary for fullwave three-dimensional (3-D) inversion of survey data can be very large.
In addition, the inversion process often requires much a priori knowledge of the subterranean strata configuration and can demand many trial-and-error parameter adjustments.
Furthermore, the nature of geophysical inversion techniques means that they generally result in only smooth earth parameterizations.

Method used


Image

  • Electromagnetic surveying for hydrocarbon reservoirs
  • Electromagnetic surveying for hydrocarbon reservoirs
  • Electromagnetic surveying for hydrocarbon reservoirs

Examples


example results

[0089]FIG. 4A schematically shows in vertical cross-section a model 2-D subterranean strata configuration beneath an area of seafloor 6. The model comprises a wedge shaped structure 40 having a resistivity of 100Ωm embedded in a uniform background having a resistivity of 1Ωm. The upper edge of the wedge 40 is approximately 2000 m below the seafloor. The wedge is around 800 m thick and has a horizontal extent of around 6000 m at its base. Depth (d) below sea-level is marked on the left-hand side of the figure. Horizontal location (x) measured from an arbitrary origin is marked along the bottom.

[0090]FIG. 4B is a grayscale plot schematically showing the real component of the scattering coefficient (Scat) calculated using the above described 2-D wavefield imaging analysis for the model subterranean strata configuration shown in FIG. 4A as a function of depth beneath sea-level (d) and horizontal position (x). A shade bar to the right of the figure shows the relationship between grayscal...


PUM


Abstract

A method of analyzing results from an underwater controlled source electromagnetic (CSEM) survey of an area that is thought or known to contain a subterranean hydrocarbon reservoir is described. The method is based on a wavefield extrapolation of narrow-band electromagnetic field data obtained from pairs of source and receiver locations. The data comprise a plurality of discrete frequencies between 0.01 Hz and 60 Hz. The wavefield extrapolation is performed for each of these discrete frequencies to provide distributions of electromagnetic scattering coefficient as a function of position and depth beneath the survey area. These distributions may then be combined to provide a displayable image of electromagnetic scattering coefficient. The method is able to quickly provide a displayable image that is readily interpretable.

Description

BACKGROUND OF THE INVENTION[0001]The present invention relates to controlled source electromagnetic (CSEM) surveying for oil and other hydrocarbon reserves.[0002]CSEM surveying is a valuable research tool used for locating oil and hydrocarbon reserves. In a typical CSEM survey, an electromagnetic (EM) source and a number of EM receivers are located at or near the seafloor. Signals broadcast by the EM source propagate outwards into the overlying seawater and downwards into the seafloor and subterranean strata. Given the typical resistivity of the respective media, propagation occurs by diffusion of electromagnetic fields. Components of the broadcast signal which are detected by the receivers carry information about the electrical properties of the media with which they have interacted. Subsequent analysis of the received signals based on geophysical inversion techniques allows features of the subterranean strata to be identified. For example, regions of high resistivity which are typ...

Claims


Application Information

Patent Timeline
Patent Type & Authority Patents(United States)
IPC IPC(8): G01V3/38G01V3/12
CPCG01V3/12G01V3/083G01V3/17G01V3/38
Inventor TOMPKINS, MICHAEL
Owner PGS GEOPHYSICAL AS
Why Eureka
Try Eureka