Supercharge Your Innovation With Domain-Expert AI Agents!

Graphical display and correlation of severity scores of system metrics

a technology of severity score and correlation, applied in the field of graphic display and correlation of severity score of system metrics, can solve problems such as preventing useful conclusions, and achieve the effect of accurately portraying the momen

Active Publication Date: 2007-07-17
ORACLE INT CORP
View PDF1 Cites 3 Cited by
  • Summary
  • Abstract
  • Description
  • Claims
  • Application Information

AI Technical Summary

Benefits of technology

[0008]In several embodiments, the computer is programmed to receive a time series of measurements (hereinafter “input time series”) of a given metric. Depending on the embodiment, the computer may be programmed to display either the instantaneous severity score at each moment in time (i.e. the instantaneous value), or an aggregate value. The aggregate value may be generated by application of any formula (such as an averaging formula) to a set of instantaneous severity scores (e.g. such a set may be defined by a window of time). Time averaging embodiments filter out or damp down momentary abnormalities in the measurements, which would otherwise get displayed. In some time averaging embodiments, the instantaneous value is displayed instead of the time averaged value during a period when a metric is detected as having just returned to normalcy, so as to accurately portray the moment at which normalcy returned.

Problems solved by technology

This precludes making useful conclusions from similar chart features that may happen to occur across the two metrics series.
The inventors note that the display of FIG. 1B (as well as FIG. 1A) has a problem, namely that such a display becomes easily dominated by one or more measurements (called “outliers”) of a metric, if their values (on the Y axis) are significantly larger than the rest of the measurements of the metric.

Method used


Image

  • Graphical display and correlation of severity scores of system metrics
  • Graphical display and correlation of severity scores of system metrics
  • Graphical display and correlation of severity scores of system metrics

Examples


Embodiment Construction

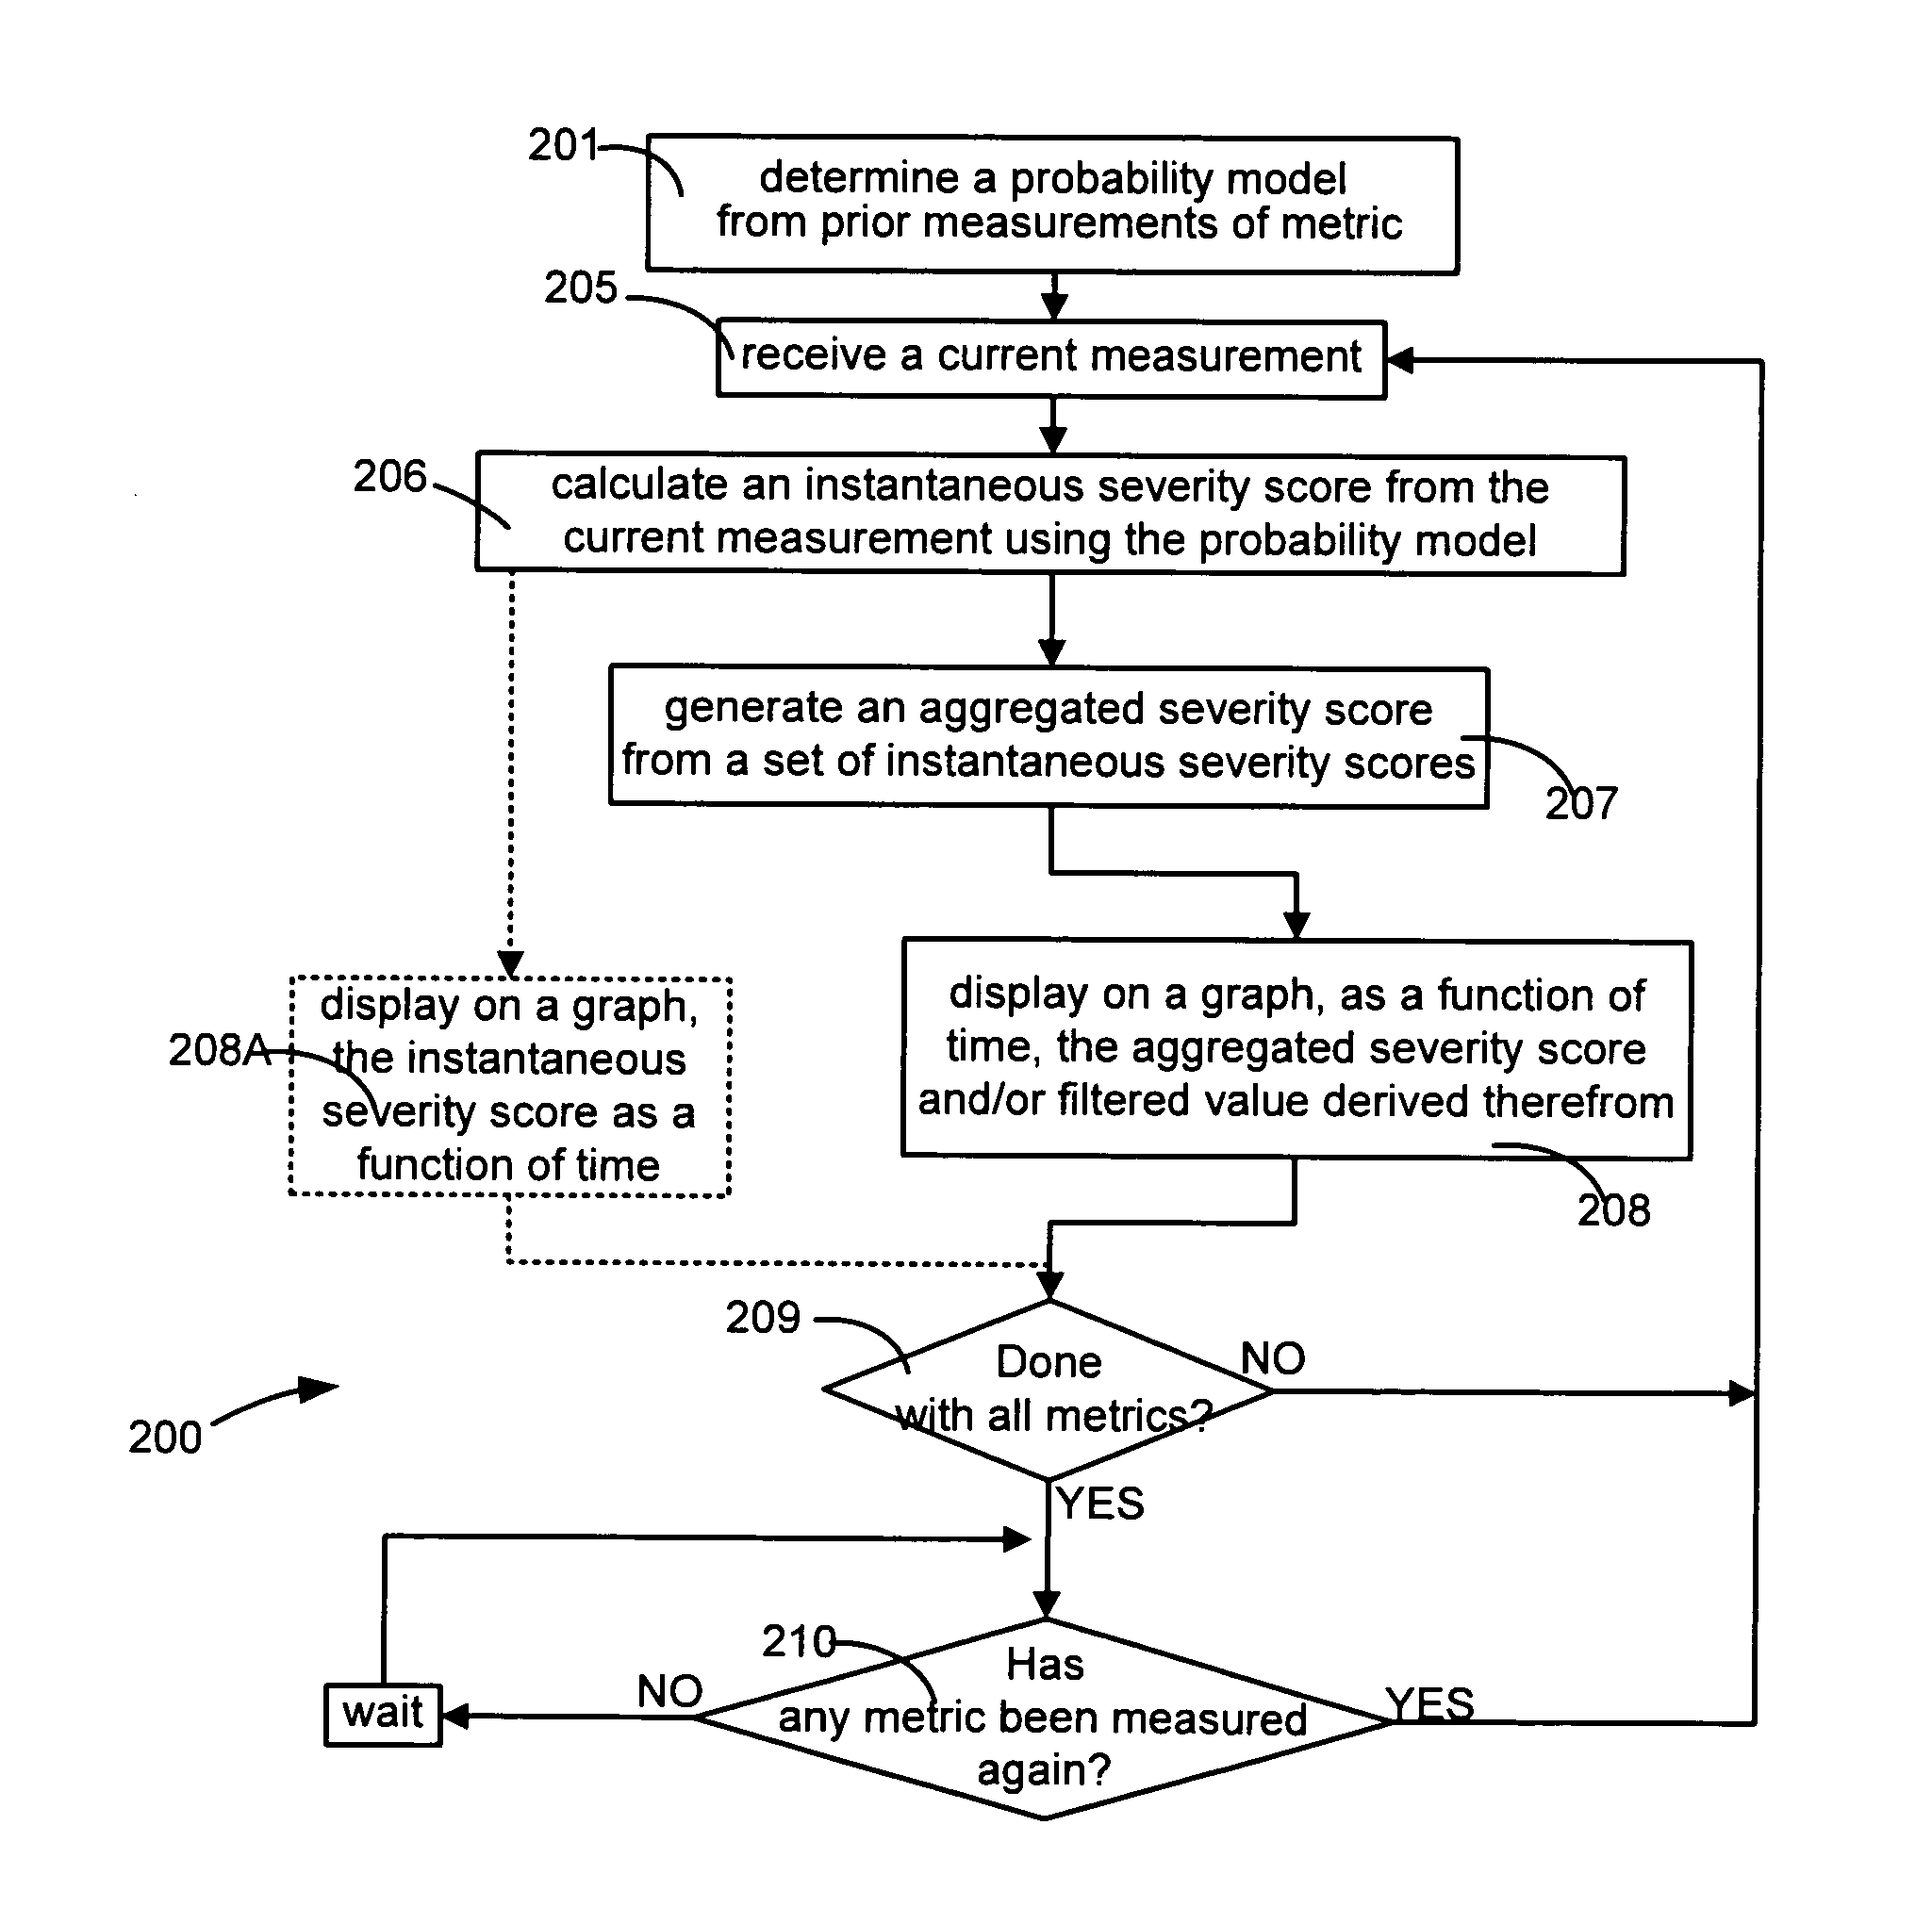
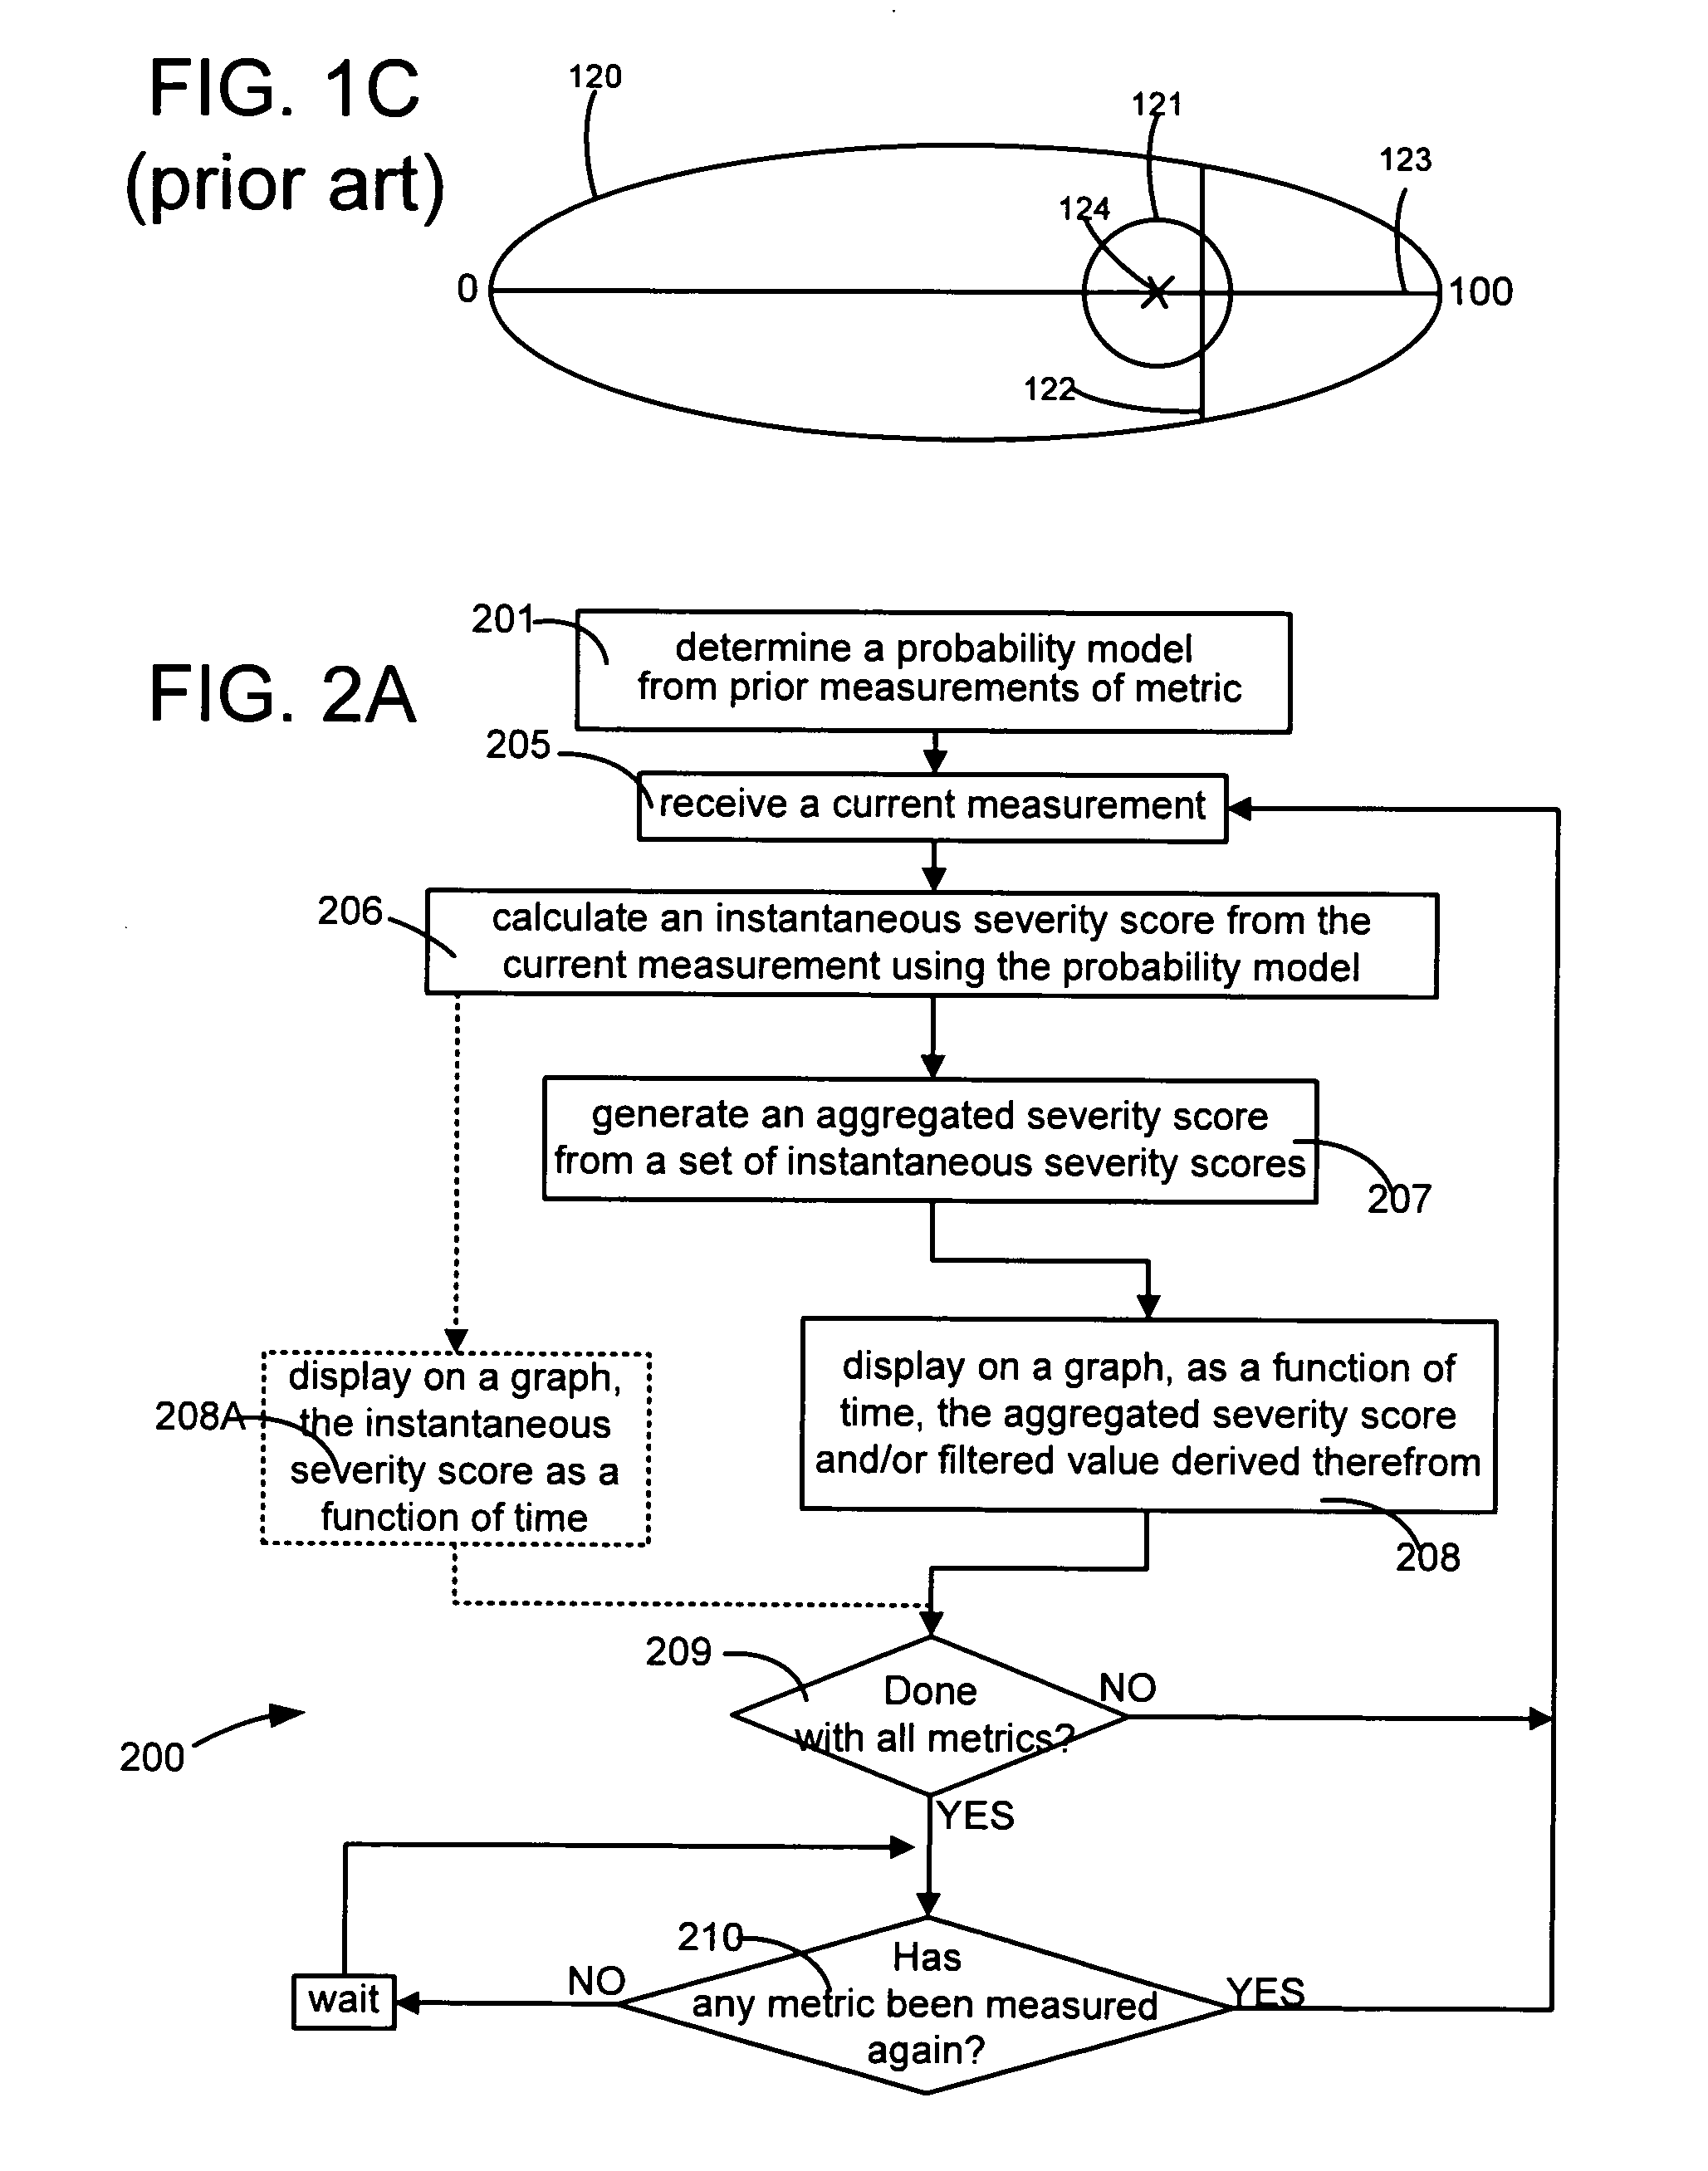
[0020]A computer 500 (illustrated in FIG. 5A) is programmed, in accordance with the invention, to automatically determine a probability model as illustrated by act 201 (FIG. 2A), from a number of measurements of a metric (hereinafter “prior measurements”), obtained at a corresponding number of moments in time in the past. Any probability model may be used in accordance with the invention to map measurements of the metric to corresponding numbers that represent scores of severity of the measurements relative to a user-selected “baseline” of prior measurements. One embodiment is based on percentile ranks that are extended to real numbers (e.g. 99.9% representing 1 in 1000 likelihood), for use in mapping of measurements of the metric to their corresponding severity scores.

[0021]A mapping is formed, in accordance with the invention, between (a) values of a metric (as observed) and (b) percentile ranks (or other probability indicators) with which severity scores are associated, by perfor...


PUM


Abstract

A computer derives, from a current measurement of an attribute of a system, an instantaneous severity score based on a probability model that is determined from prior measurements. The computer then displays, for several successive moments in time, either the instantaneous severity score or an aggregated severity score obtained from a set of instantaneous severity scores (e.g. by averaging). Each set of scores to be aggregated may be identified by, e.g., a fixed-width time window located at a fixed offset from a moment in time at which the aggregated score is to be displayed. Aggregation suppresses or dampens momentary abnormalities, which would otherwise get displayed. In some embodiments, graphs for multiple categories of metrics are displayed on a single screen, aligned in time, to enable a human operator to form a visual correlation therebetween, e.g. to identify causes of atypical performance in the system.

Description

BACKGROUND[0001]A tool called Task Manager in the Windows XP operating system available from Microsoft Corporation, has a tab 100 for performance metrics, wherein four graphical displays of system performance are shown as illustrated in FIG. 1A. Two graphical displays 101 and 102 are for a current point in time, and respectively show the current CPU Usage, and PF Usage. Two additional graphical displays 103 and 104 in tab 100 show the CPU Usage History, and Page File Usage History. Display 101 for CPU Usage shows the amount of current processor usage, expressed as a percentage of total capacity. Display 103 for CPU Usage History shows the percentage of CPU capacity used over time. Display 102 for PF Usage shows the amount of virtual memory that has been “committed” or used. Display 104 for Page File Usage History shows usage of virtual memory over time.[0002]Displays 103 and 104 appear to be showing actual metric values on the Y-axis, as measured. When fixed thresholds are used to g...

Claims


Application Information

Patent Timeline
IPC IPC(8): G06F15/00
CPCG06F11/328G06F11/3409G06F2201/81
Inventor BERESNIEWICZ, JOHN M.NAJMI, AMIRSOULE, JONATHAN F.
Owner ORACLE INT CORP
Features
  • R&D
  • Intellectual Property
  • Life Sciences
  • Materials
  • Tech Scout
  • Unparalleled Data Quality
  • Higher Quality Content
  • 60% Fewer Hallucinations
Learn More