Method for process optimization and control by comparison between 2 or more measured scatterometry signals

a scatterometry signal and process optimization technology, applied in the field of photolithography methods and systems, can solve the problems of short circuits, reducing the selling price of chips, and the final circuit may not run properly or not at all

Active Publication Date: 2008-04-01
KLA TENCOR TECH CORP
View PDF31 Cites 62 Cited by
  • Summary
  • Abstract
  • Description
  • Claims
  • Application Information

AI Technical Summary

Benefits of technology

[0013]The invention relates, in one embodiment, to a process control method. The method includes obtaining scatterometry signals by performing scatterometry measurements on at least two grating structures with different process responses. The at least two gratings structures are located within the same field and in close proximity to one another. The method also includes comparing scatterometry signals from the at least two different grating structures in order to ascertain information about one or more process parameters used to form the at least two grating structures. The method further includes controlling the one or more process parameters based on the comparison. The comparison may include determining the difference between scatterometry signals from the at least two grating structures.
[0014]The invention relates, in another embodiment, to a method for controlling one or more process parameters. The method includes obtaining scatterometry signals for at least two grating structures. Each of the grating structures produces a scatterometry signal having different sensitivities to one or more process parameters which are desired to be controlled. The method also includes comparing scatterometry signals in order to ascertain information about one or more process parameters used to form the different grating structures. Each of the scatterometry targets are configured to produce different scatterometry signals. The differences are attributable at least in part to one or more process parameters.
[0015]The invention relates, in another embodiment, to a method of determining optimal or best focus. The method includes forming a target group at a plurality of focus settings. The target group containing two or more targets with different sensitivities to focus. The method also includes obtaining scatterometry signals for each of the targets in the target groups. The method further includes calculating difference signals for each target group. The method additionally includes forming a relationship between the difference signal or a property of the difference signal to the focus settings. Moreover, the method includes determining optimal or best focus using the relationship.
[0016]The invention relates, in another embodiment, to a process control method. The method includes measuring two or more measurable patterns that are configured to produce different scatterometry signals. The differences between the scatterometry signals being due at least in part to one or more process parameters used to create the measurable patterns. The method also includes analyzing the difference signals to determine the best process conditions for a photolithographic process. The analyzing step includes extracting information about one or more process parameters out of the difference signals.
[0017]The invention relates, in another embodiment, to a target group. The target group includes two or more scatterometry targets configured to have different process responses. The two or more scatterometry targets are located within the same field and in close proximity to one another. The scatterometry targets with different process response produce different scatterometry signals. The differences in the scatterometry signals are attributable at least in part to one or more process parameters used to create the scatterometry targets.

Problems solved by technology

If the resist profile changes are too great, then the final circuit may not run properly or it may not run at all.
By way of example, linewidth is one factor that determines the speed and the timing across the circuit and thus changes thereto may cause one portion of the circuit to run faster or slower than another portion of the circuit (thereby reducing the selling price of the chip since the circuit is clocked to the slower portion).
In addition, changes to the resist profile may cause open or shorted circuits such that the circuit may need to be discarded or reworked.
These plots are generally harder to obtain since measuring these shapes is often a difficult endeavor.
Unfortunately, the method described above has several drawbacks.
For one, the focus and exposure tests are performed periodically and thus the process may drift out of control between tests.
An out of control process may lead to wafers that may need to be scrapped or reworked thus reducing yield and increasing costs.
Another drawback is that the lithography system has to stop production in order to perform the tests.
As should be appreciated, stopping the production run reduces the throughput of the lithography system thereby increasing cycle time and cost.
Unfortunately, however, the focus of the photolithographic system may (and often does) drift over time making the assumption of constant focus false.
Accordingly, this method may not be very accurate since two variables (focus and exposure) may affect the CD rather than one.
Furthermore, it should be noted that it is generally not possible to independently manipulate two variables simultaneously (e.g., both focus and exposure) due to the fact that a single measurement type, CD, is the only available test that may be routinely performed, i.e., CD-SEM is typically only capable of measuring CD (e.g., unless using tilted beam CD-SEM).

Method used


Image

  • Method for process optimization and control by comparison between 2 or more measured scatterometry signals
  • Method for process optimization and control by comparison between 2 or more measured scatterometry signals
  • Method for process optimization and control by comparison between 2 or more measured scatterometry signals

Examples


Embodiment Construction

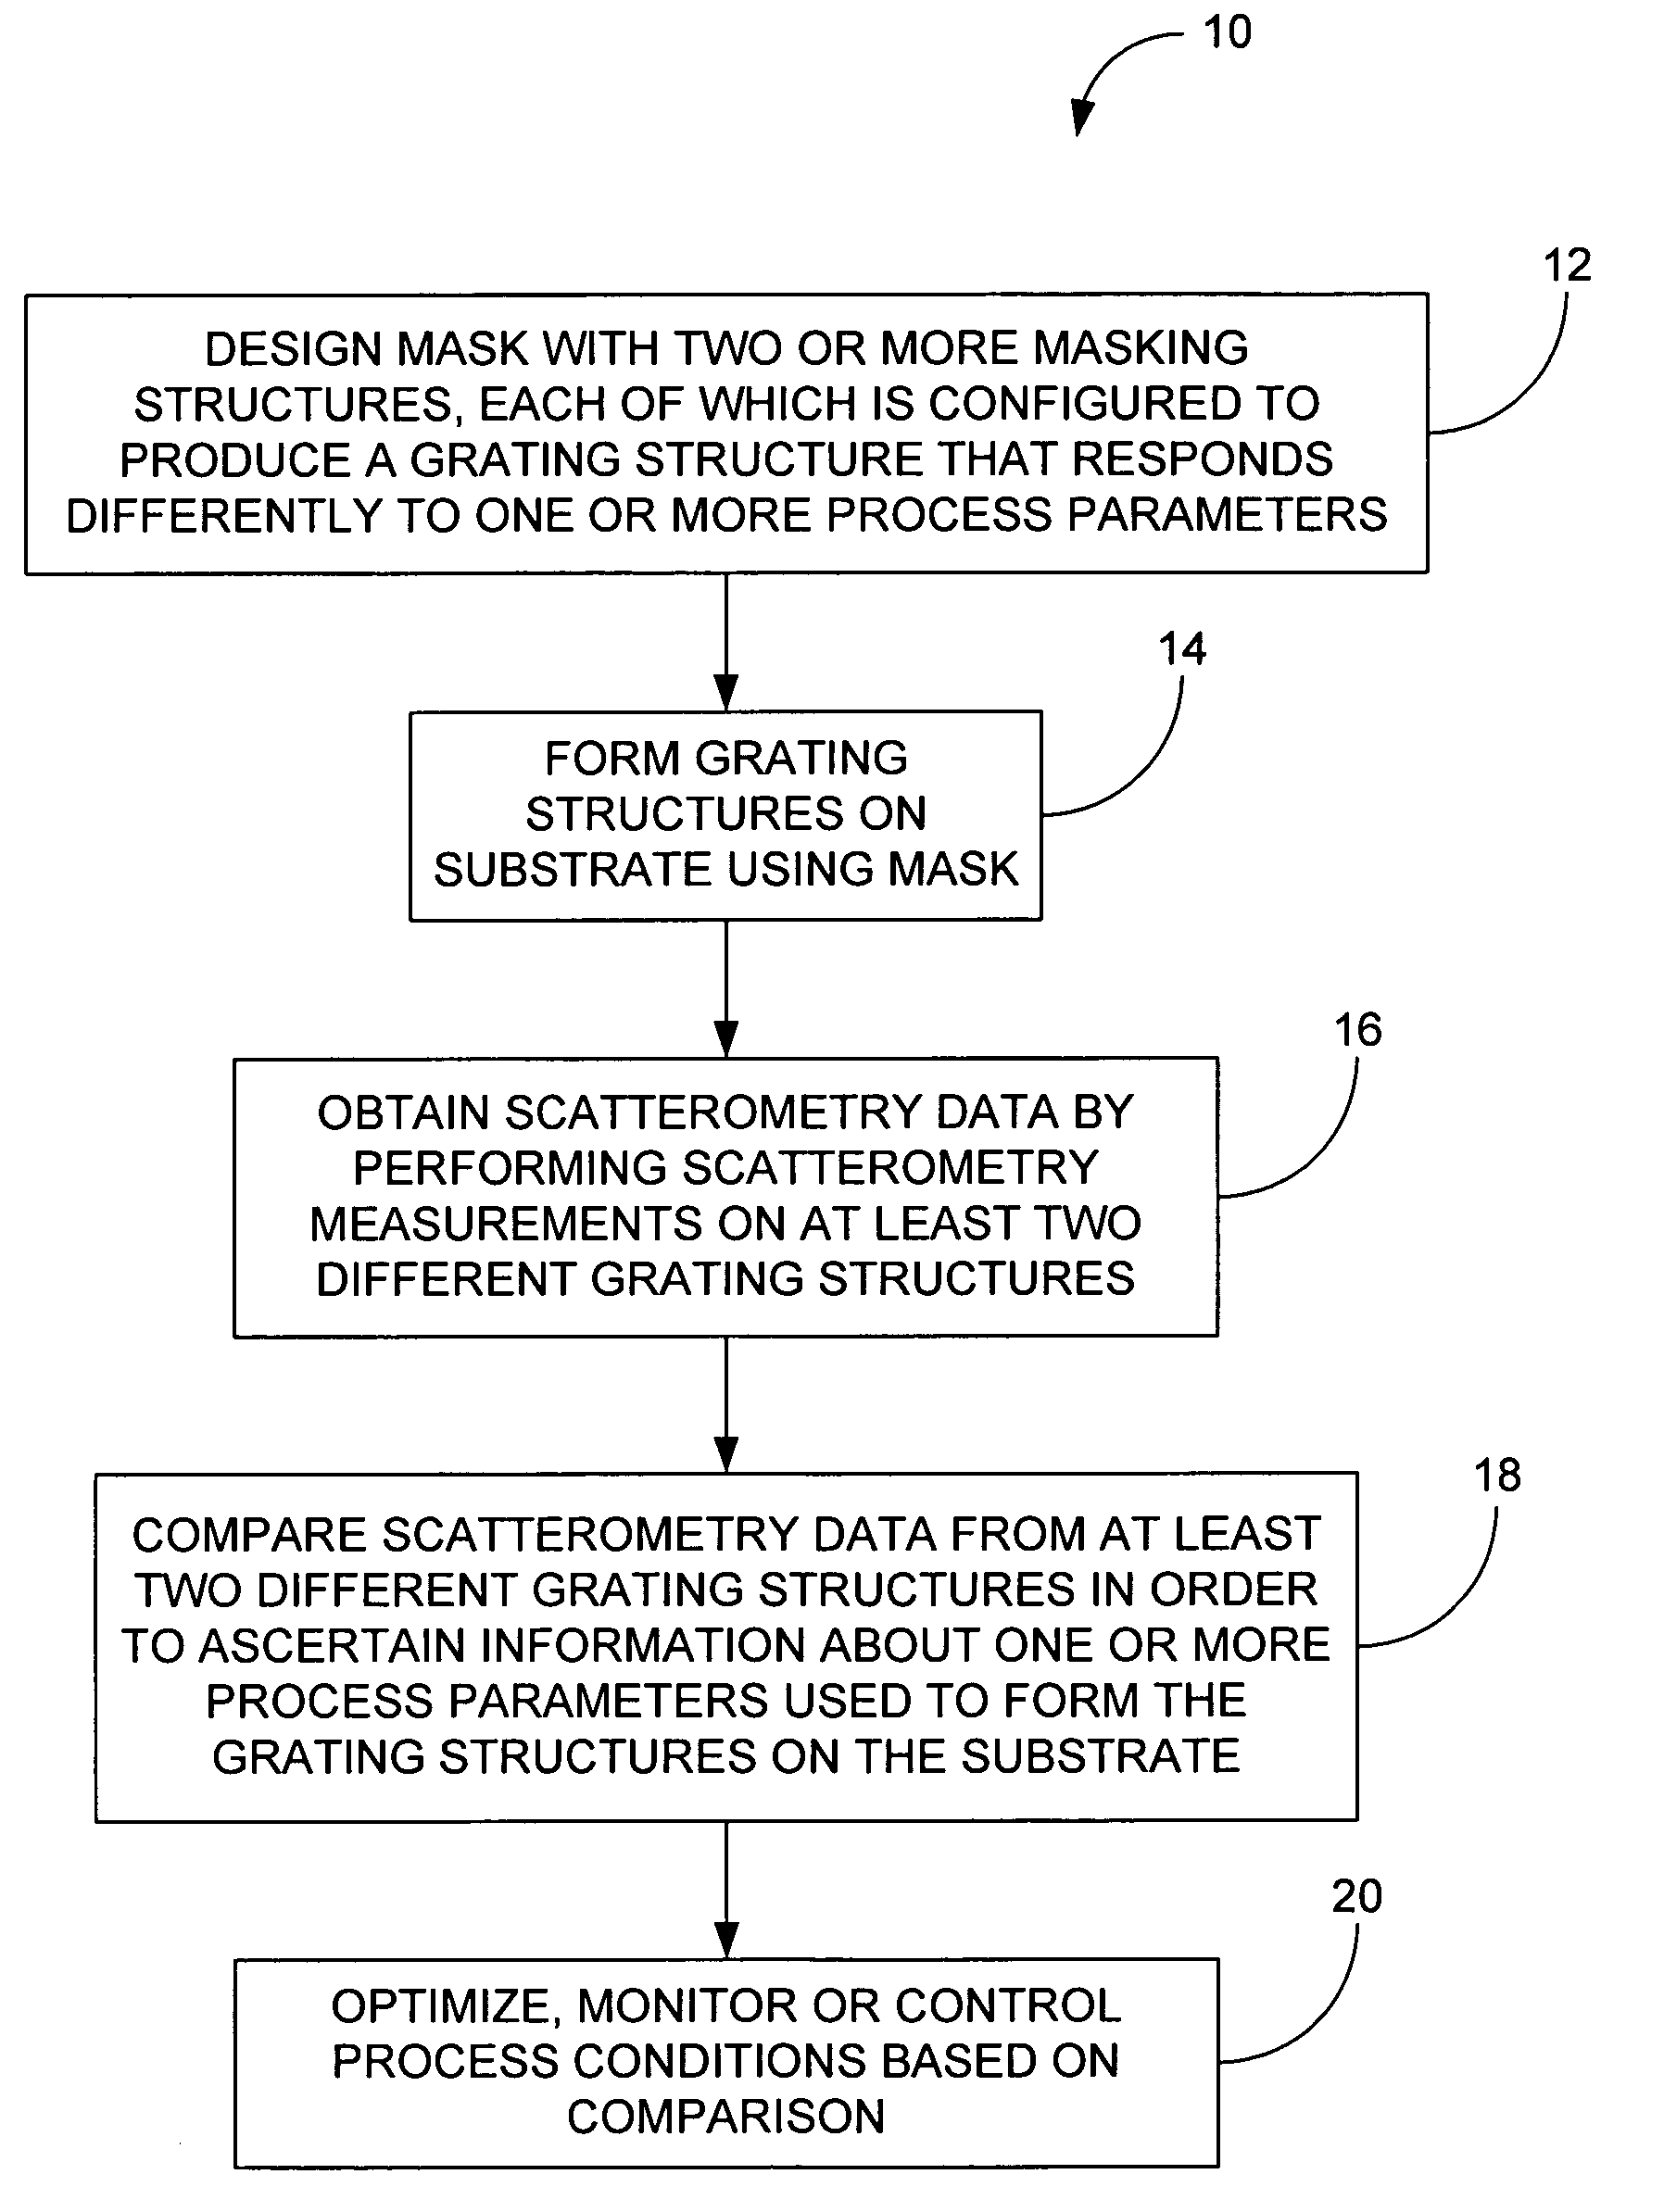
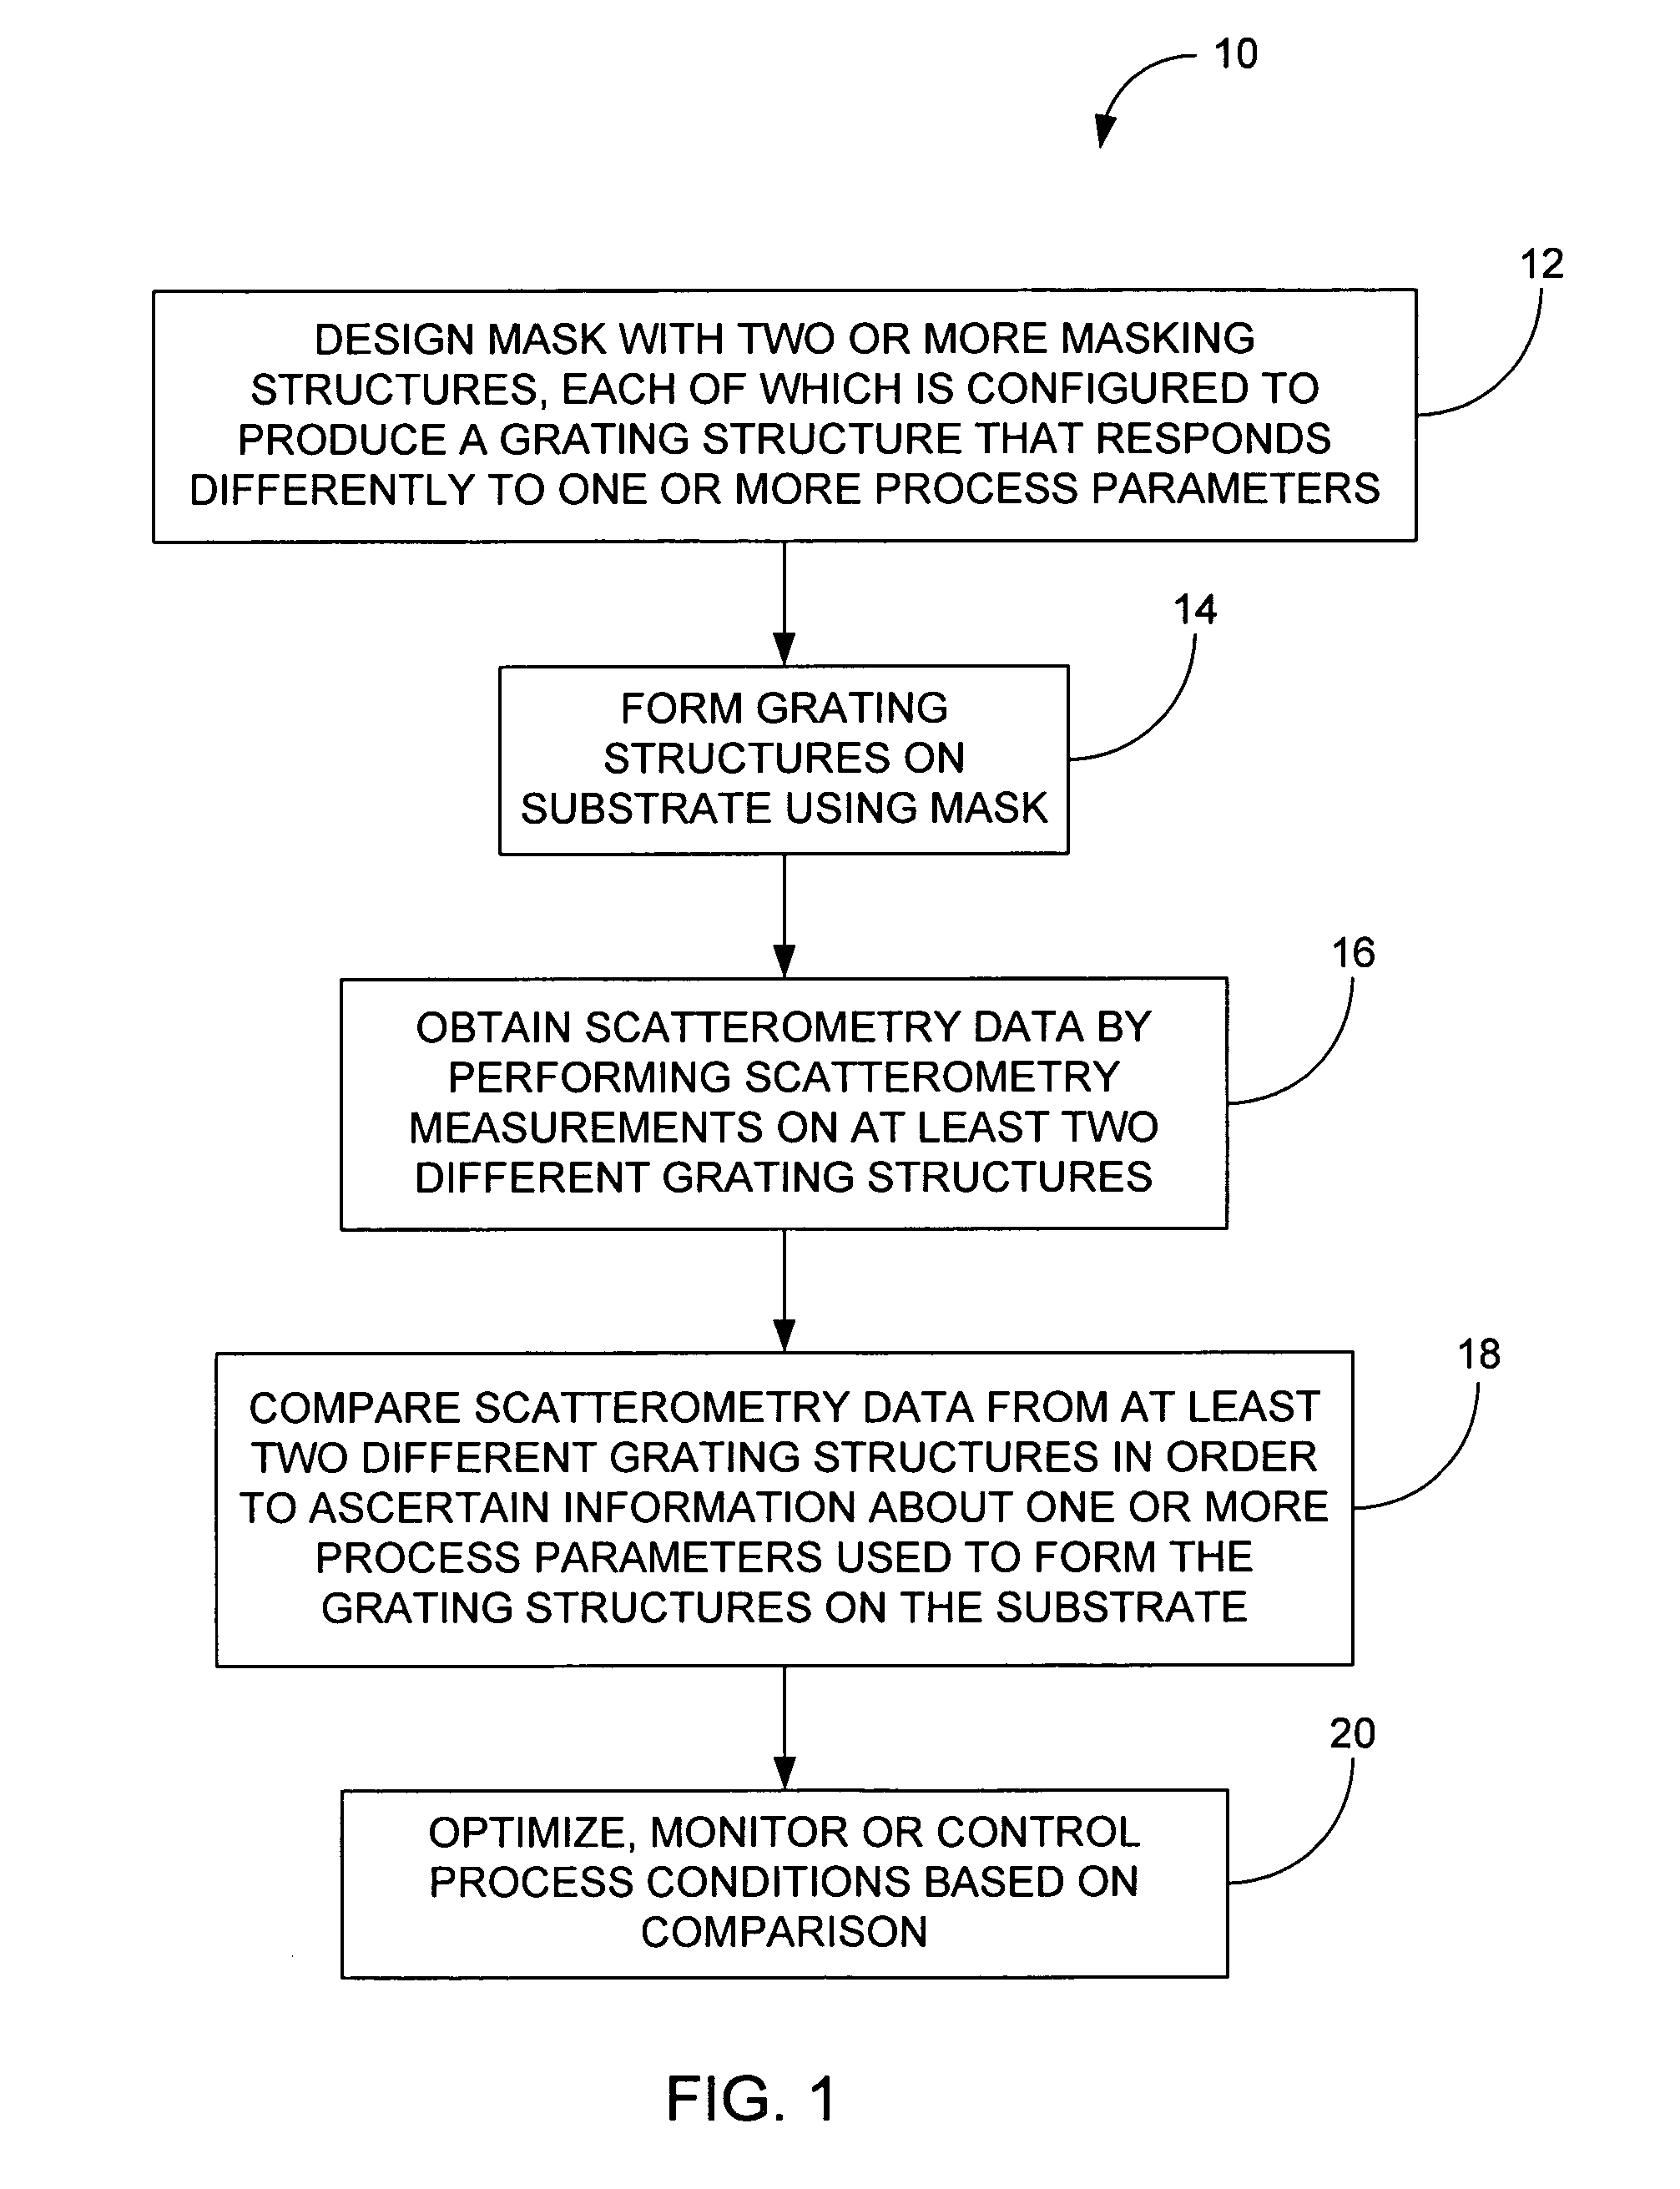
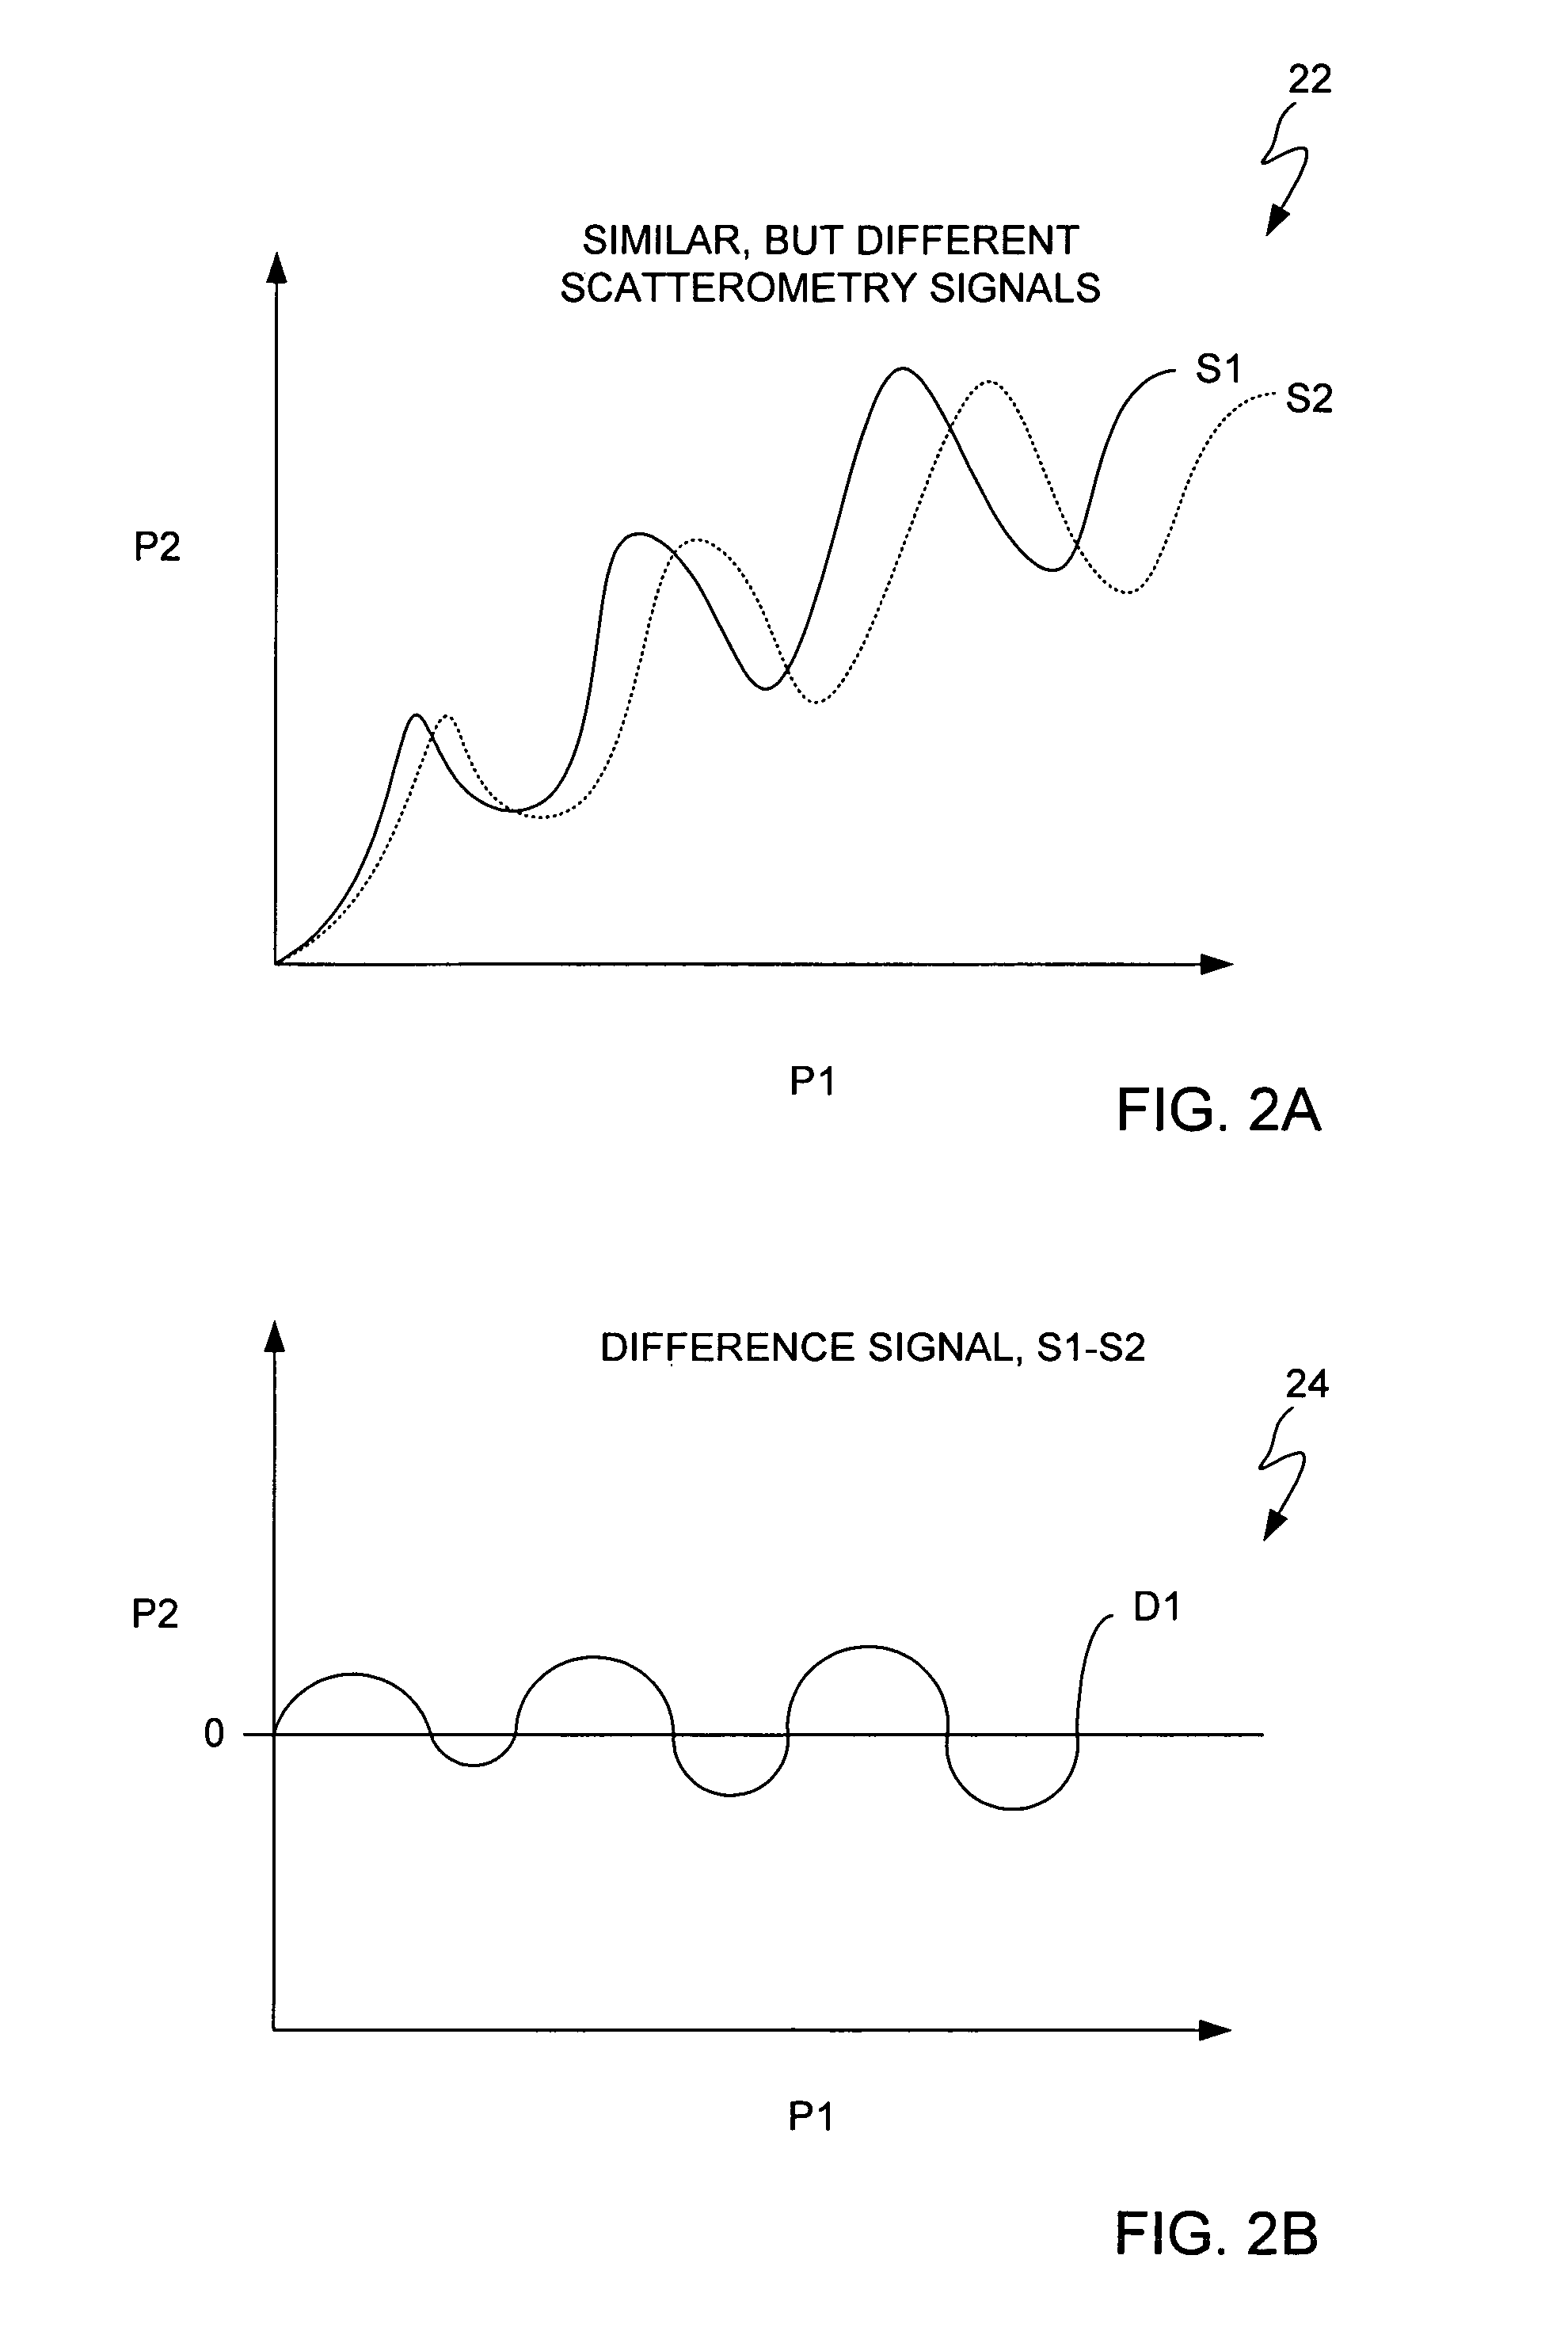
[0037]The general objective of the invention is to monitor, optimize and control photolithographic processes using scatterometry measurements and carefully designed measurement sites. The invention generally includes measuring two or more measurable patterns that are configured to produce different scatterometry signals. The differences between the signals are preferably due to one or more process parameters used to create the measurable patterns. The difference signals therefore can be monitored to determine the best process conditions for photolithographic process. For example, information about the process parameters can be extracted out of the difference signals since the differences are based at least partially on the process parameters.

[0038]More particularly, the invention includes performing scatterometry measurements on a set of at least two grating structures that have differences that are attributable to one or more process parameters, i.e., when the grating structures we...


PUM

PropertyMeasurementUnit
anglesaaaaaaaaaa
DAaaaaaaaaaa
wavelengthsaaaaaaaaaa

Abstract

A method for determining one or more process parameter settings of a photolithographic system is disclosed.

Description

CROSS REFERENCE TO RELATED APPLICATIONS[0001]This application claims the priority of the following U.S. patent applications, which are hereby incorporated herein by reference:[0002]Application No. 60 / 441,048, filed on Jan. 17, 2003 and entitled “METHOD FOR PROCESS OPTIMIZATION AND CONTROL BY COMPARISON BETWEEN 2 OR MORE MEASURED SCATTEROMETRY SIGNALS”;[0003]This application is also related to the following U.S. patent applications, which is hereby incorporated herein by reference:[0004]Application Ser. No. 10 / 186,294, filed on Jun. 26, 2002 and entitled “METHOD FOR DETERMINING LITHOGRAPHIC FOCUS AND EXPOSURE.”[0005]Application Ser. No. 10 / 291,181, filed on Nov. 7, 2002 and entitled “FOCUS MASKING STRUCTURES, FOCUS PATTERNS AND MEASUREMENTS THEREOF.”FIELD OF THE INVENTION [0006]The present invention relates generally to photolithography methods and systems, and more specifically to improved techniques for determining focus and exposure settings of a photolithographic system.BACKGROUN...

Claims


Application Information

Patent Timeline
Patent Type & Authority Patents(United States)
IPC IPC(8): G01B9/00G01B11/00G01B11/14G01B11/28G03C5/00G03FG03F7/20G03F9/00
CPCG01N21/956G01N21/95607G03F7/70483G03F7/70533G03F7/70558G03F7/70625G03F7/70641H01L22/12H01L22/20G01N21/211G01N21/47H01L2924/0002G01N2021/8416H01L2924/00
Inventor MIEHER, WALTER D.MACK, CHRIS A.HANKINSON, MATT
Owner KLA TENCOR TECH CORP
Why Eureka
Try Eureka