Graphical displaying of and pattern recognition in analytical data strings

Active Publication Date: 2008-06-10
BRUKER DALTONIK GMBH & CO KG
View PDF11 Cites 1 Cited by
  • Summary
  • Abstract
  • Description
  • Claims
  • Application Information

AI Technical Summary

Benefits of technology

[0013]With this method the researcher can inspect the collections of data strings before and after the mathematical investigation, and easily check the success of the pattern recognition programs.

Problems solved by technology

Here, the graphical display is more difficult, but in many cases it is sufficient to just show the total ion current chromatograms with their peaks representing the biosubstances.
In some cases it may even be difficult to refer back to the peaks (and substances) responsible for some recognized pattern, e.g., if the principal components for a cluster presentation is a non-linear combination of the parameters of many peaks.

Method used


Image

  • Graphical displaying of and pattern recognition in analytical data strings
  • Graphical displaying of and pattern recognition in analytical data strings
  • Graphical displaying of and pattern recognition in analytical data strings

Examples


Embodiment Construction

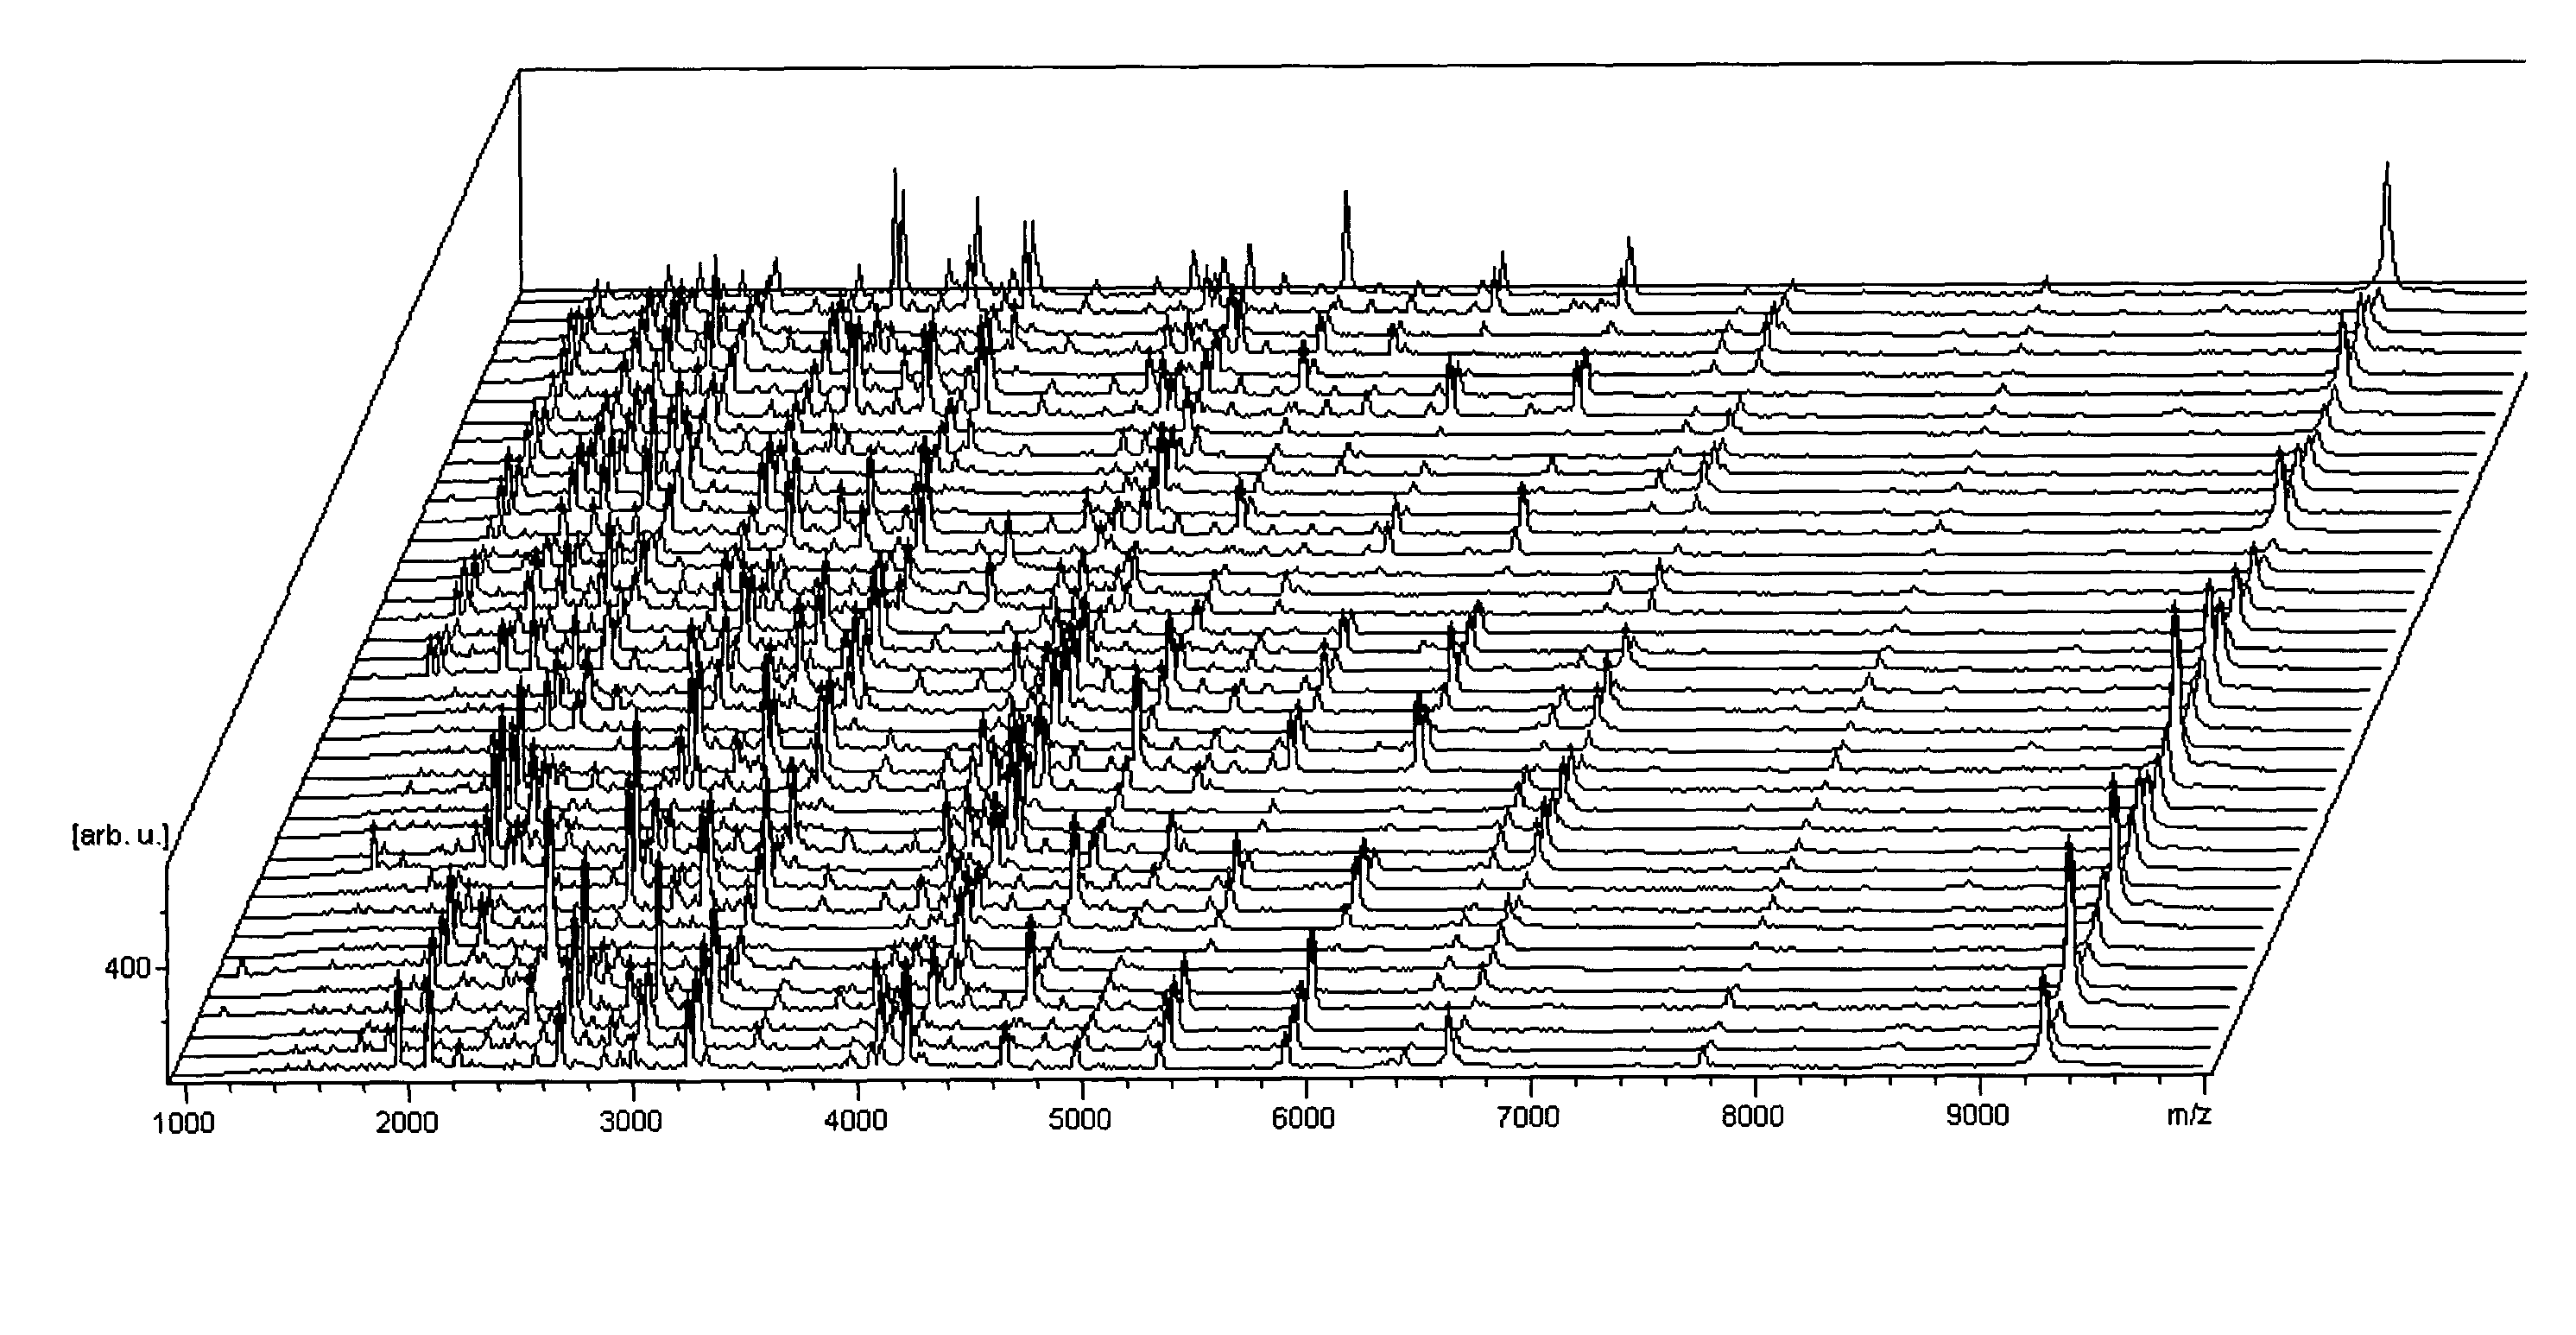
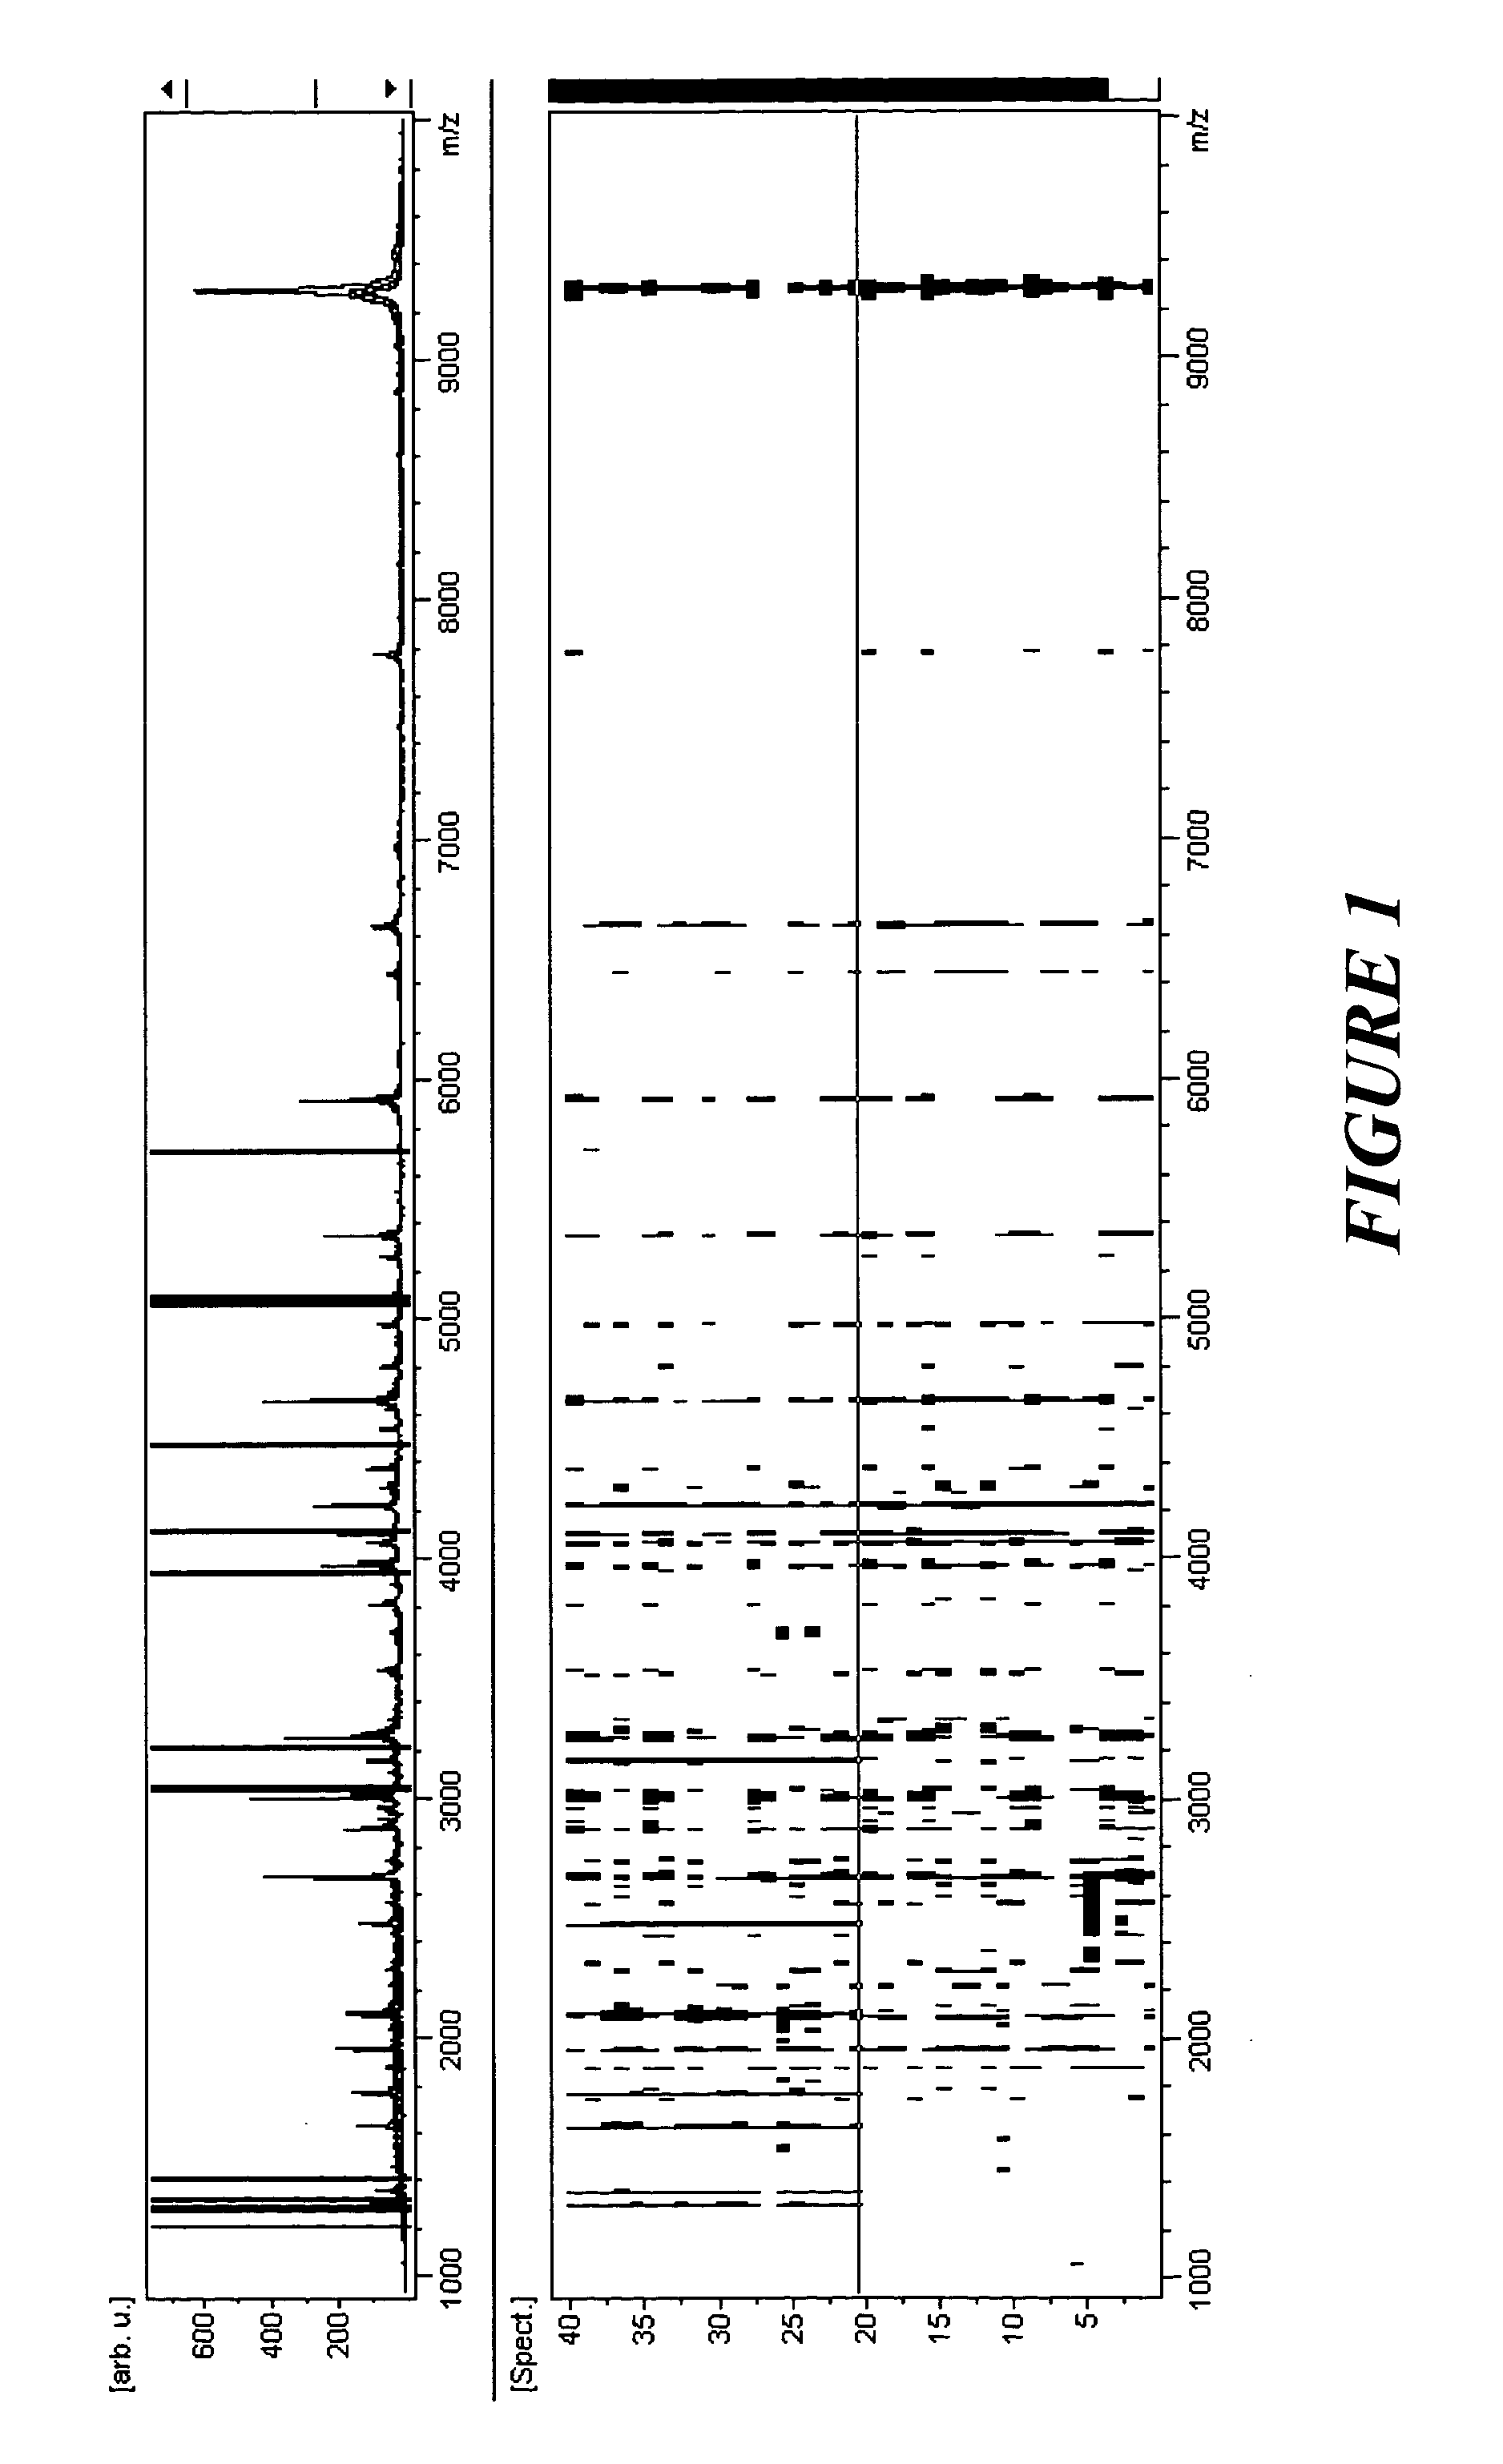
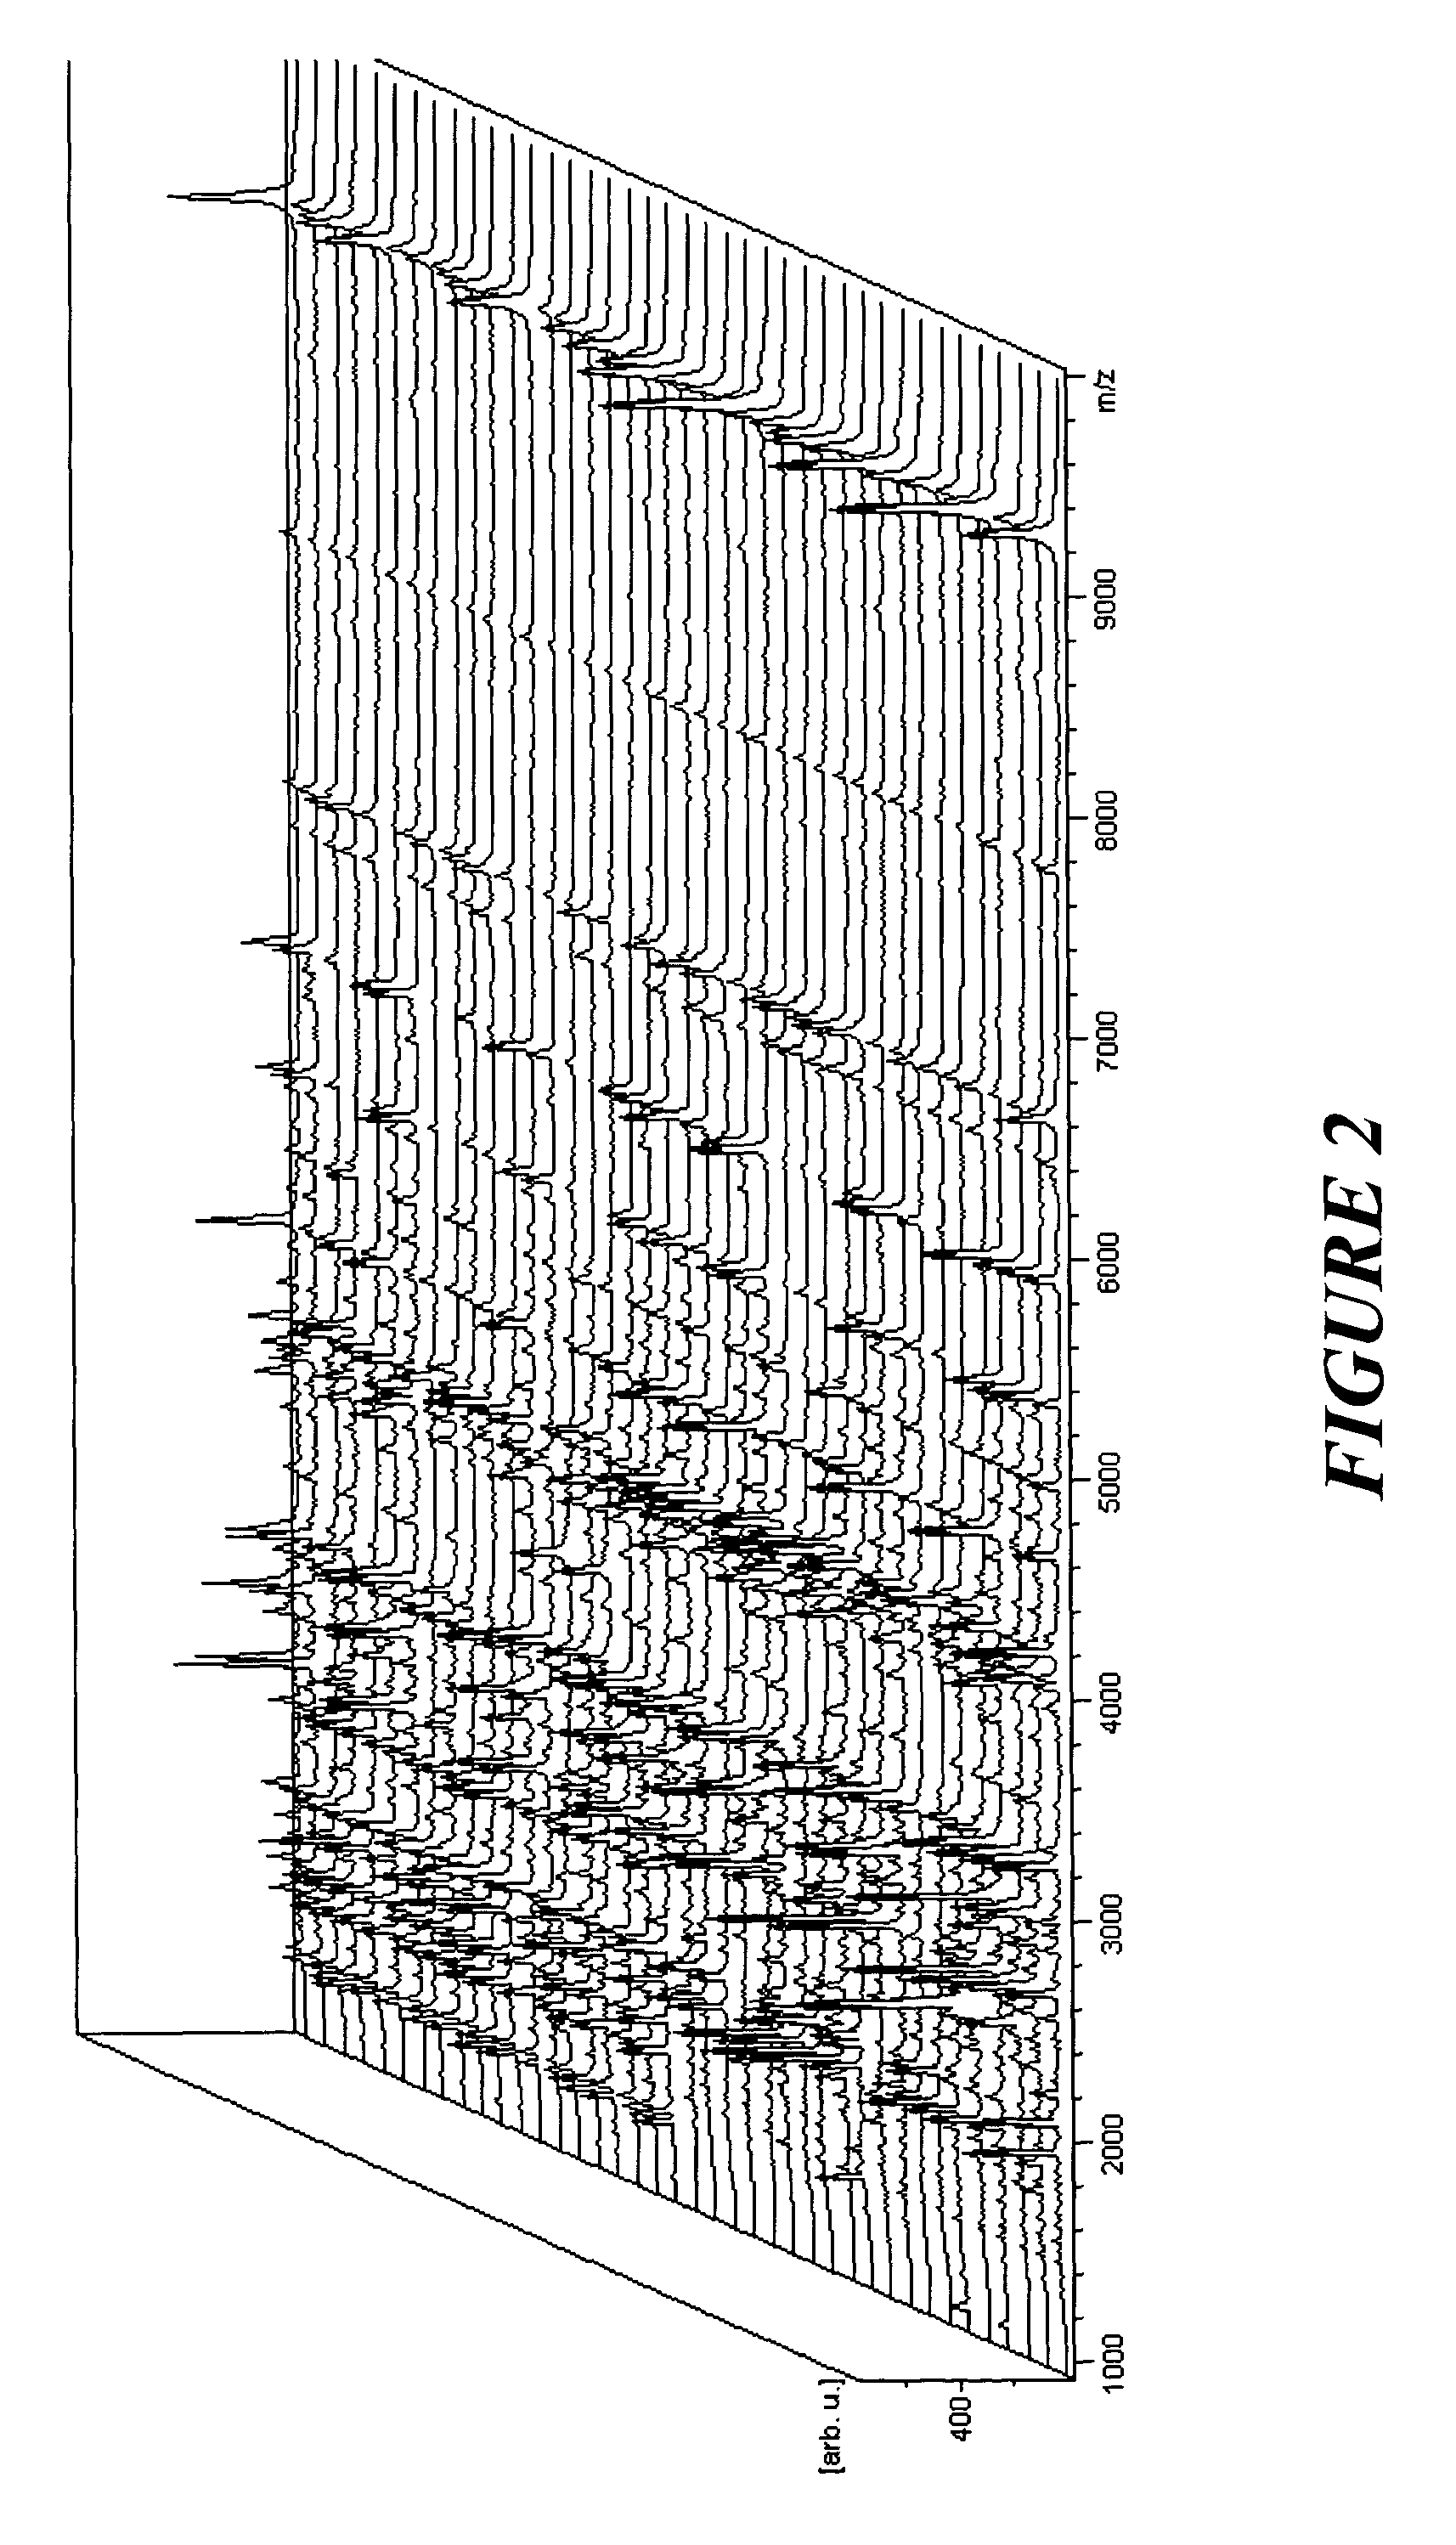
[0021]The invention will be described in detail using the example of clinical proteomics by mass spectrometric investigation of affinity-captured protein extractions from body fluids.

[0022]Clinical proteomics is a research branch searching for marker patterns which can be used to recognize early states of diseases which cannot be found otherwise, or which can only be diagnosed hitherto by very complicated and costly procedures. In a more general sense, clinical proteomics tries to gain insight into mechanisms for protein regulation by stresses. A widely used procedure is described here.

[0023]From two groups of patients, healthy patients and patients with a well-characterized disease, individual samples of body fluid are acquired. Blood, urine, saliva, lymph, or spinal fluid may serve as such a body fluid, even cell lysates or cell culture supernatants may be used; all samples must belong to the same type of body fluid.

[0024]Proteins are extracted from these samples by affinity extra...


PUM


Abstract

The present invention relates to graphic presentations of complex analytical data strings containing each a multitude of substance-representing peaks (e.g. mass spectra or chromatograms) and pattern recognition or classification techniques in collections of such data strings. The invention proposes to highlight, after execution of the pattern recognition or classification algorithms, the significantly participating peaks in the graphical display so that the nature of these peaks, and the substances represented by these peaks, can easily be further investigated. The content of the graphical display, particularly the peaks, can be interactively accessed by the user and by the pattern recognition programs.

Description

FIELD OF INVENTION[0001]The present invention relates to graphic presentations of complex analytical data strings containing each a multitude of substance-representing peaks and to pattern recognition or classification techniques in collections of such data strings.BACKGROUND OF THE INVENTION[0002]In many fields of science, collections of mass spectra, optical absorption spectra, chromatograms, electrophorograms or other analytical peak-containing strings of digital data are investigated with respect to inherent patterns and correlations of such patterns with external parameters of the original samples where the data strings are acquired from. The strings of data describe each the distribution of “peak intensities” along a scale of a “scaling parameter” which may be a “mass” (mass spectrometry) or “retention time” (chromatography) or the like. As a rule, the acquisition of such data strings is performed by a chemical analysis procedure, and the peaks each represent a certain substan...

Claims


Application Information

Patent Timeline
IPC IPC(8): G06K9/46G06F3/048
CPCG06K9/0053H01J49/0036G06F2218/10
Inventor KAMINSKI, HERBERTWURMBACH, JAN-HENNERPUSCH, WOLFGANG
Owner BRUKER DALTONIK GMBH & CO KG
Why Eureka
Try Eureka