
Data visualization within an integrated asset data system for a process plant

Active Publication Date: 2009-02-17
FISHER-ROSEMOUNT SYST INC
View PDF142 Cites 25 Cited by
  • Summary
  • Abstract
  • Description
  • Claims
  • Application Information

AI Technical Summary

Benefits of technology

[0015]A process plant data collection and viewing system uses a common or integrated navigational tree structure and one or more common display formats to enable a user to view, in a similar and consistent manner, information obtained from different applications or data sources within a process plant at any desired level of integration, even though the actual data from the multiple different data applications or data sources may be collected and organized in different manners by different data sources. Because a common visualization of information is provided at different levels of data integration, a user can easily navigate through the data stored in the database or collected by the different data sources at higher or lower levels of data integration without having to contend with or encounter multiple different viewing formats for the same type of data.

Problems solved by technology

Such optimizers typically use complex models of the plant to predict how inputs may be changed to optimize operation of the plant with respect to some desired optimization variable such as, for example, profit.
Unfortunately, each of the different applications is generally different in the manner in which it uses and applies this navigation tree structure, including the names and, sometimes, the meaning of the names used therein, and is different in the manner in which it provides views of the data collected by that application.
This makes cross use of these applications tedious and sometimes confusing.
Furthermore, it makes it very difficult to organize the information provided from different applications in a single and consistent manner, or to enable a user to view the information from different sources, i.e., applications, using a single navigational tool.
As a result, while these applications can share data with one another and with a centralized database, there is no simple technique of organizing the shared data in a manner that makes sense or is easy to use by a person viewing or accessing all of the data from the different applications or a way of presenting that data to a user in an organized and easily understood manner.

Method used


Image

  • Data visualization within an integrated asset data system for a process plant
  • Data visualization within an integrated asset data system for a process plant
  • Data visualization within an integrated asset data system for a process plant

Examples


Embodiment Construction

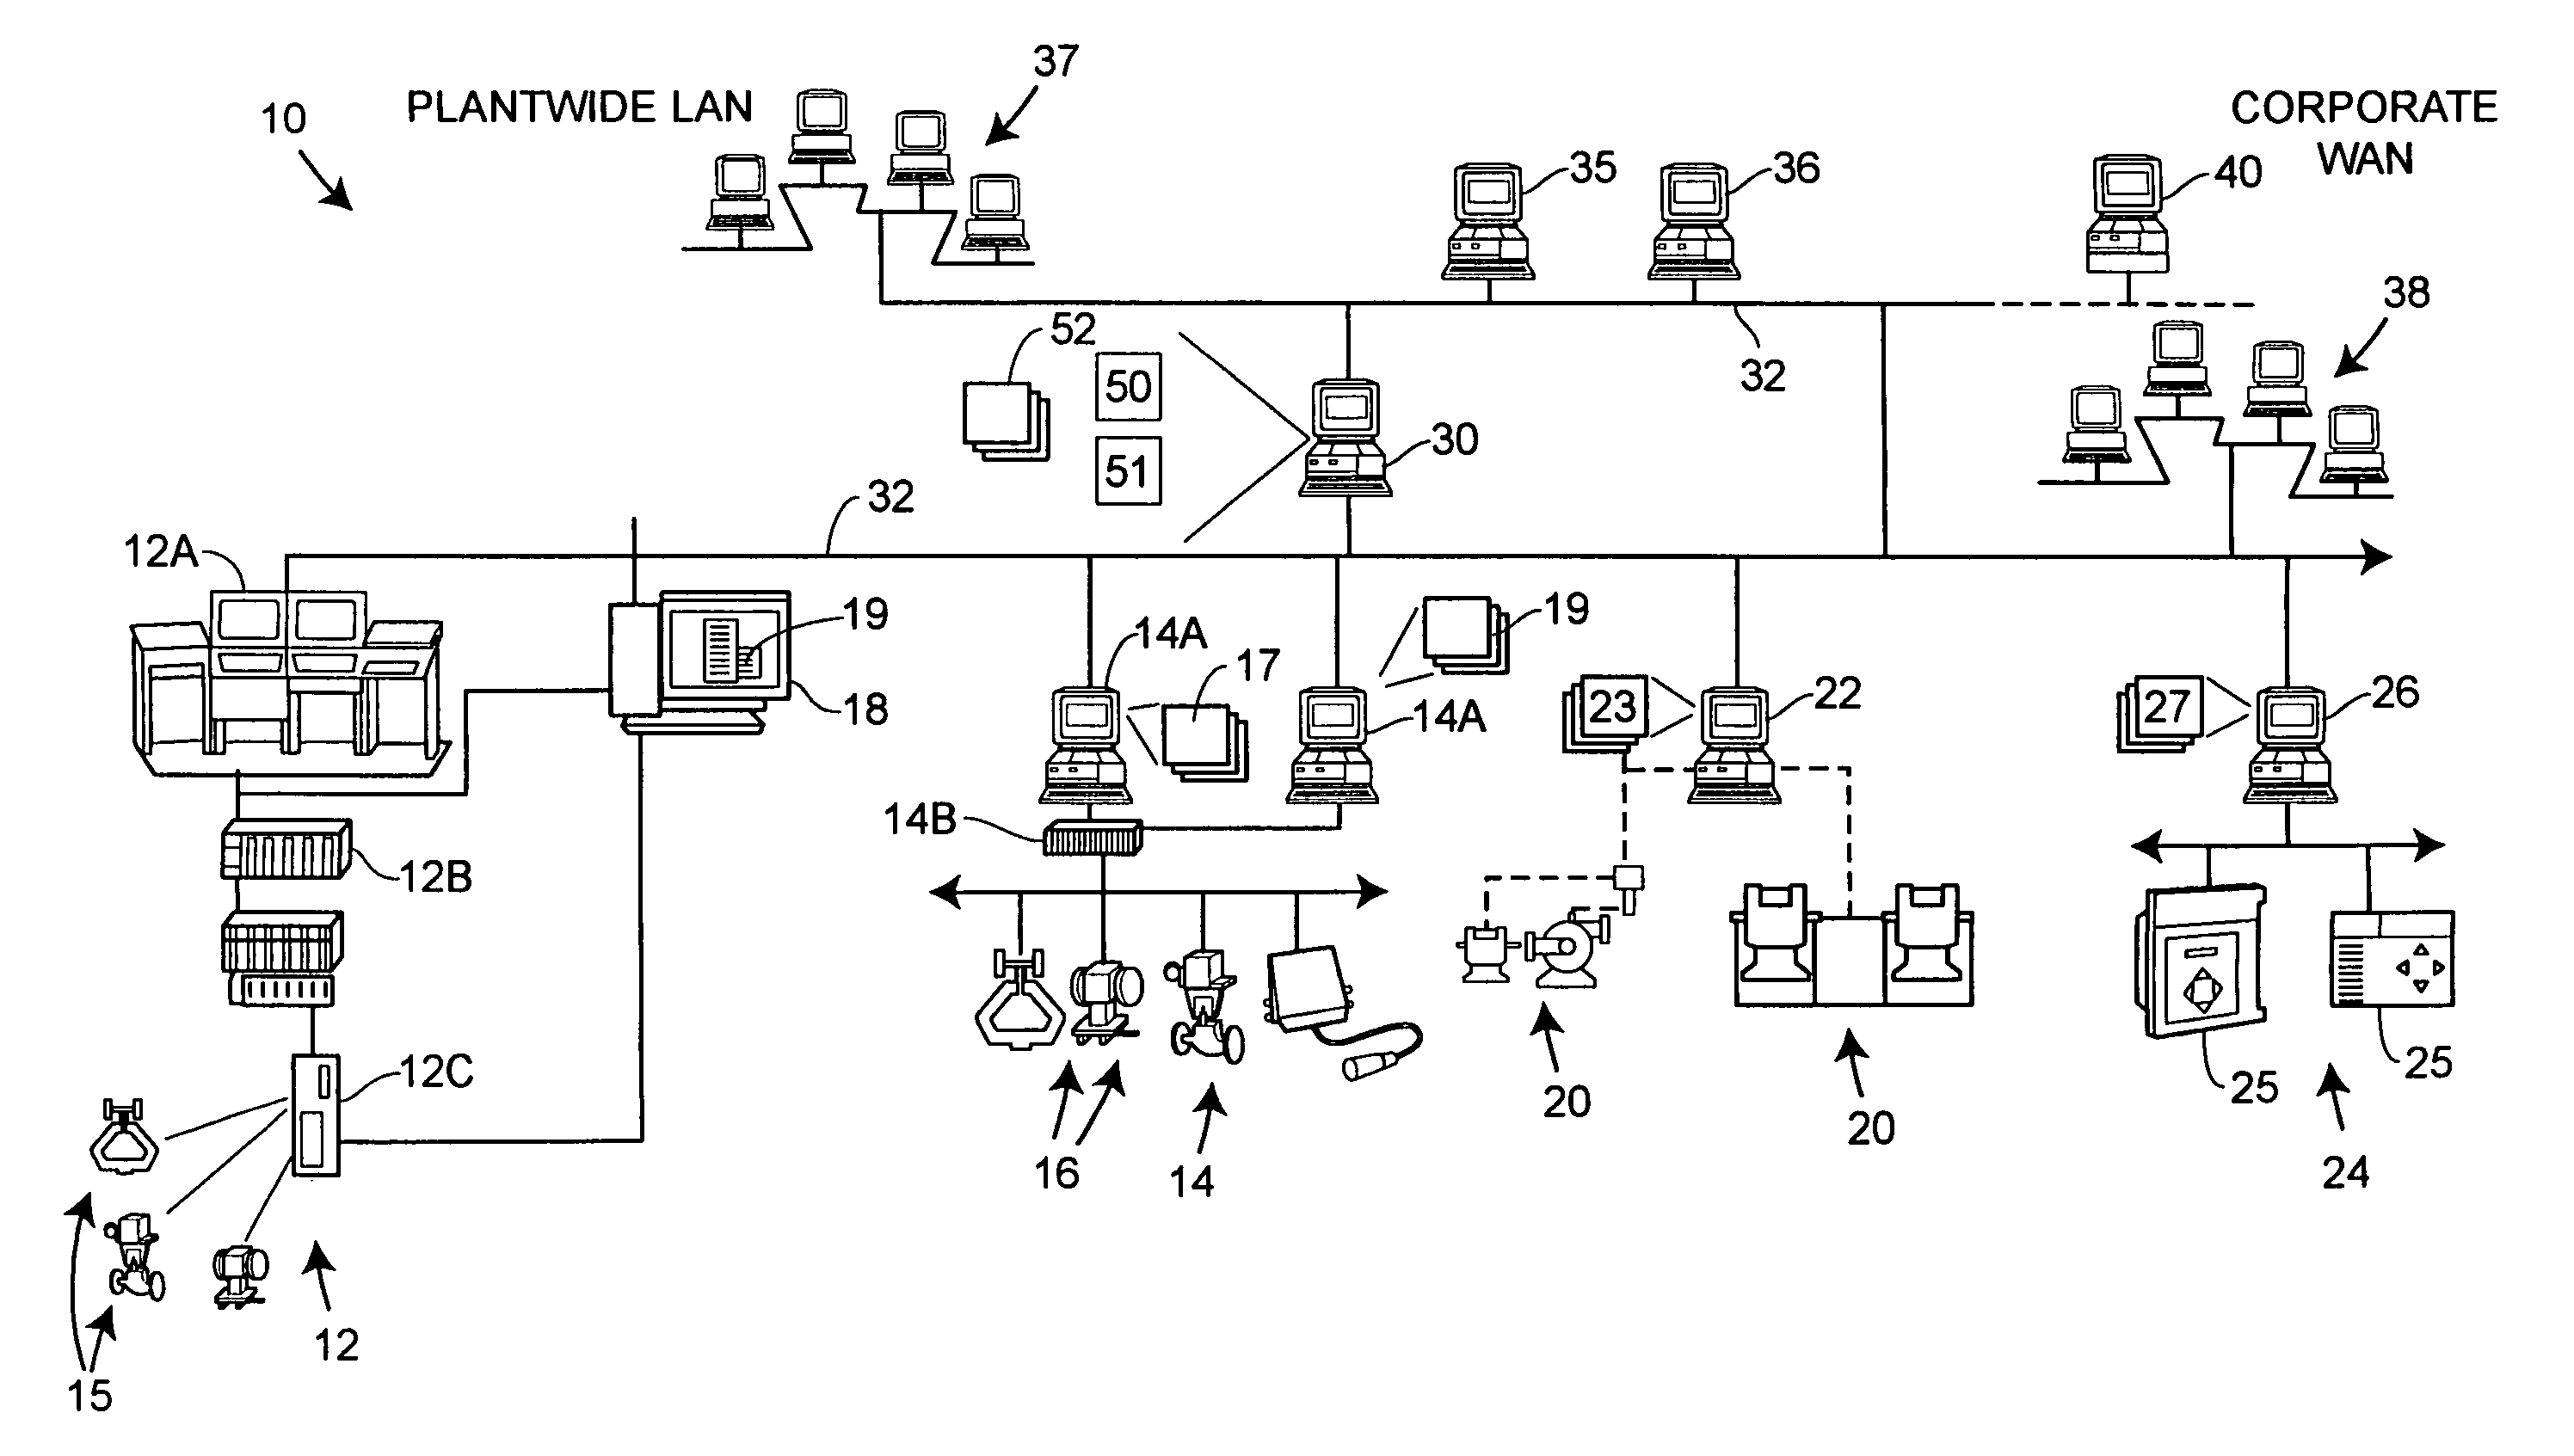
[0036]Referring now to FIG. 1, a process plant 10 (which may be located in a single geographical location or at multiple geographical locations) includes a number of business and other computer systems interconnected with a number of control and maintenance systems by one or more communication networks. The process plant 10 includes one or more process control systems 12 and 14. The process control system 12 may be a traditional process control system such as a PROVOX or RS3 system or may be a DCS which includes an operator interface 12A coupled to a controller 12B and to input / output (I / O) cards 12C which, in turn, are coupled to various field devices such as analog and Highway Addressable Remote Transmitter (HART) field devices 15. The process control system 14, which may be a distributed process control system, includes one or more operator interfaces 14A coupled to one or more distributed controllers 14B via a bus, such as an Ethernet bus. The controllers 14B may be, for example...


PUM


Abstract

A process plant data collection and viewing system uses a common or integrated navigational tree structure and one or more common display formats to enable a user to view, in a similar and consistent manner, information obtained from different applications or data sources within a process plant at any desired level of integration, even though the actual data from the multiple different data applications or data sources may be collected and organized in different manners by different data sources. Because a common visualization of information is provided at different levels of data integration, a user can easily navigate through the data stored in the database or collected by the different data sources at higher or lower levels of data integration without having to contend with or encounter multiple different viewing formats for the same type of data.

Description

RELATED APPLICATIONS[0001]This is a continuation-in-part of U.S. patent application Ser. No. 10 / 331,974 entitled “Integrated navigational Tree Importation and Generation in a Process Plant” which was filed on Dec. 30, 2002 and which is hereby expressly incorporated by reference herein.FIELD OF TECHNOLOGY[0002]This relates generally to process plant maintenance, control and viewing applications and, more particularly, to the visualization of information stored in or associated with an asset data system used to collect data for one or more process plants.BACKGROUND[0003]Process plants, such as those used in chemical, petroleum or other industries, typically include one or more centralized or decentralized process controllers communicatively coupled to at least one host or operator workstation and to one or more process control and instrumentation devices, such as field devices, via analog, digital or combined analog / digital buses. Field devices, which may be, for example valves, valve...

Claims


Application Information

Patent Timeline
IPC IPC(8): G06F17/30G05B19/418G05B23/02
CPCG05B19/418G05B23/0216G05B23/0267G05B23/0272G05B2219/31334G05B2219/31467G05B2219/33152G05B2219/36121Y02P90/02Y02P80/10Y02P90/80Y10S707/99935Y10S707/99934Y10S707/99933
Inventor ERYUREK, EVRENHARRIS, STUARTHOKENESS, SCOTT N.
Owner FISHER-ROSEMOUNT SYST INC
Learn More