Automatic fault classification for model-based process monitoring

a technology of automatic fault classification and model-based process monitoring, applied in the field of automatic fault classification, can solve problems such as poor clustering, distorted clustering solution, and inability to localize, and achieve the effect of reducing the dependence on human operators

Active Publication Date: 2009-05-12
HONEYWELL INT INC
View PDF23 Cites 53 Cited by
  • Summary
  • Abstract
  • Description
  • Claims
  • Application Information

AI Technical Summary

Benefits of technology

[0011]It is yet another aspect of the present invention to provide an improved data-processing method and system that can be used as a part of an abnormal situation management product offering.
[0012]It is a further aspect of the present invention to provide for a system and method for the automation of fault localization to reduce dependence on human operators.

Problems solved by technology

Although numerous state estimators exist, such as Principal Component Analysis (PCA), that are able to detect abnormality, the challenge lies in the translation of their output into information that is meaningful to the process operator.
While capable of detecting various anomalies, these applications are only able to localize some predefined failure conditions.
Unfortunately, this representation can potentially lead to poor clustering results.
This is because a process is usually measured by large number of sensors, while each fault is usually caused by only a small part of the process.
Therefore, if residuals of all sensors are used to represent excursions, the resulting clustering solution may be distorted by sensors unrelated to the detected faults.
One of the limitations of existing clustering approaches is that they do not take into account the closeness of data points' time of occurrence as an indication of belonging to the same event and possibly to the same cluster.
These algorithms also fail to take into account special characteristics of each abnormality and noise in the data, and thus can result in incorrect decisions, which may to lead to the generation of clusters that do not represent event definitions.

Method used


Image

  • Automatic fault classification for model-based process monitoring
  • Automatic fault classification for model-based process monitoring
  • Automatic fault classification for model-based process monitoring

Examples


Embodiment Construction

[0025]The particular values and configurations discussed in these non-limiting examples can be varied and are cited merely to illustrate at least one embodiment and are not intended to limit the scope of the invention.

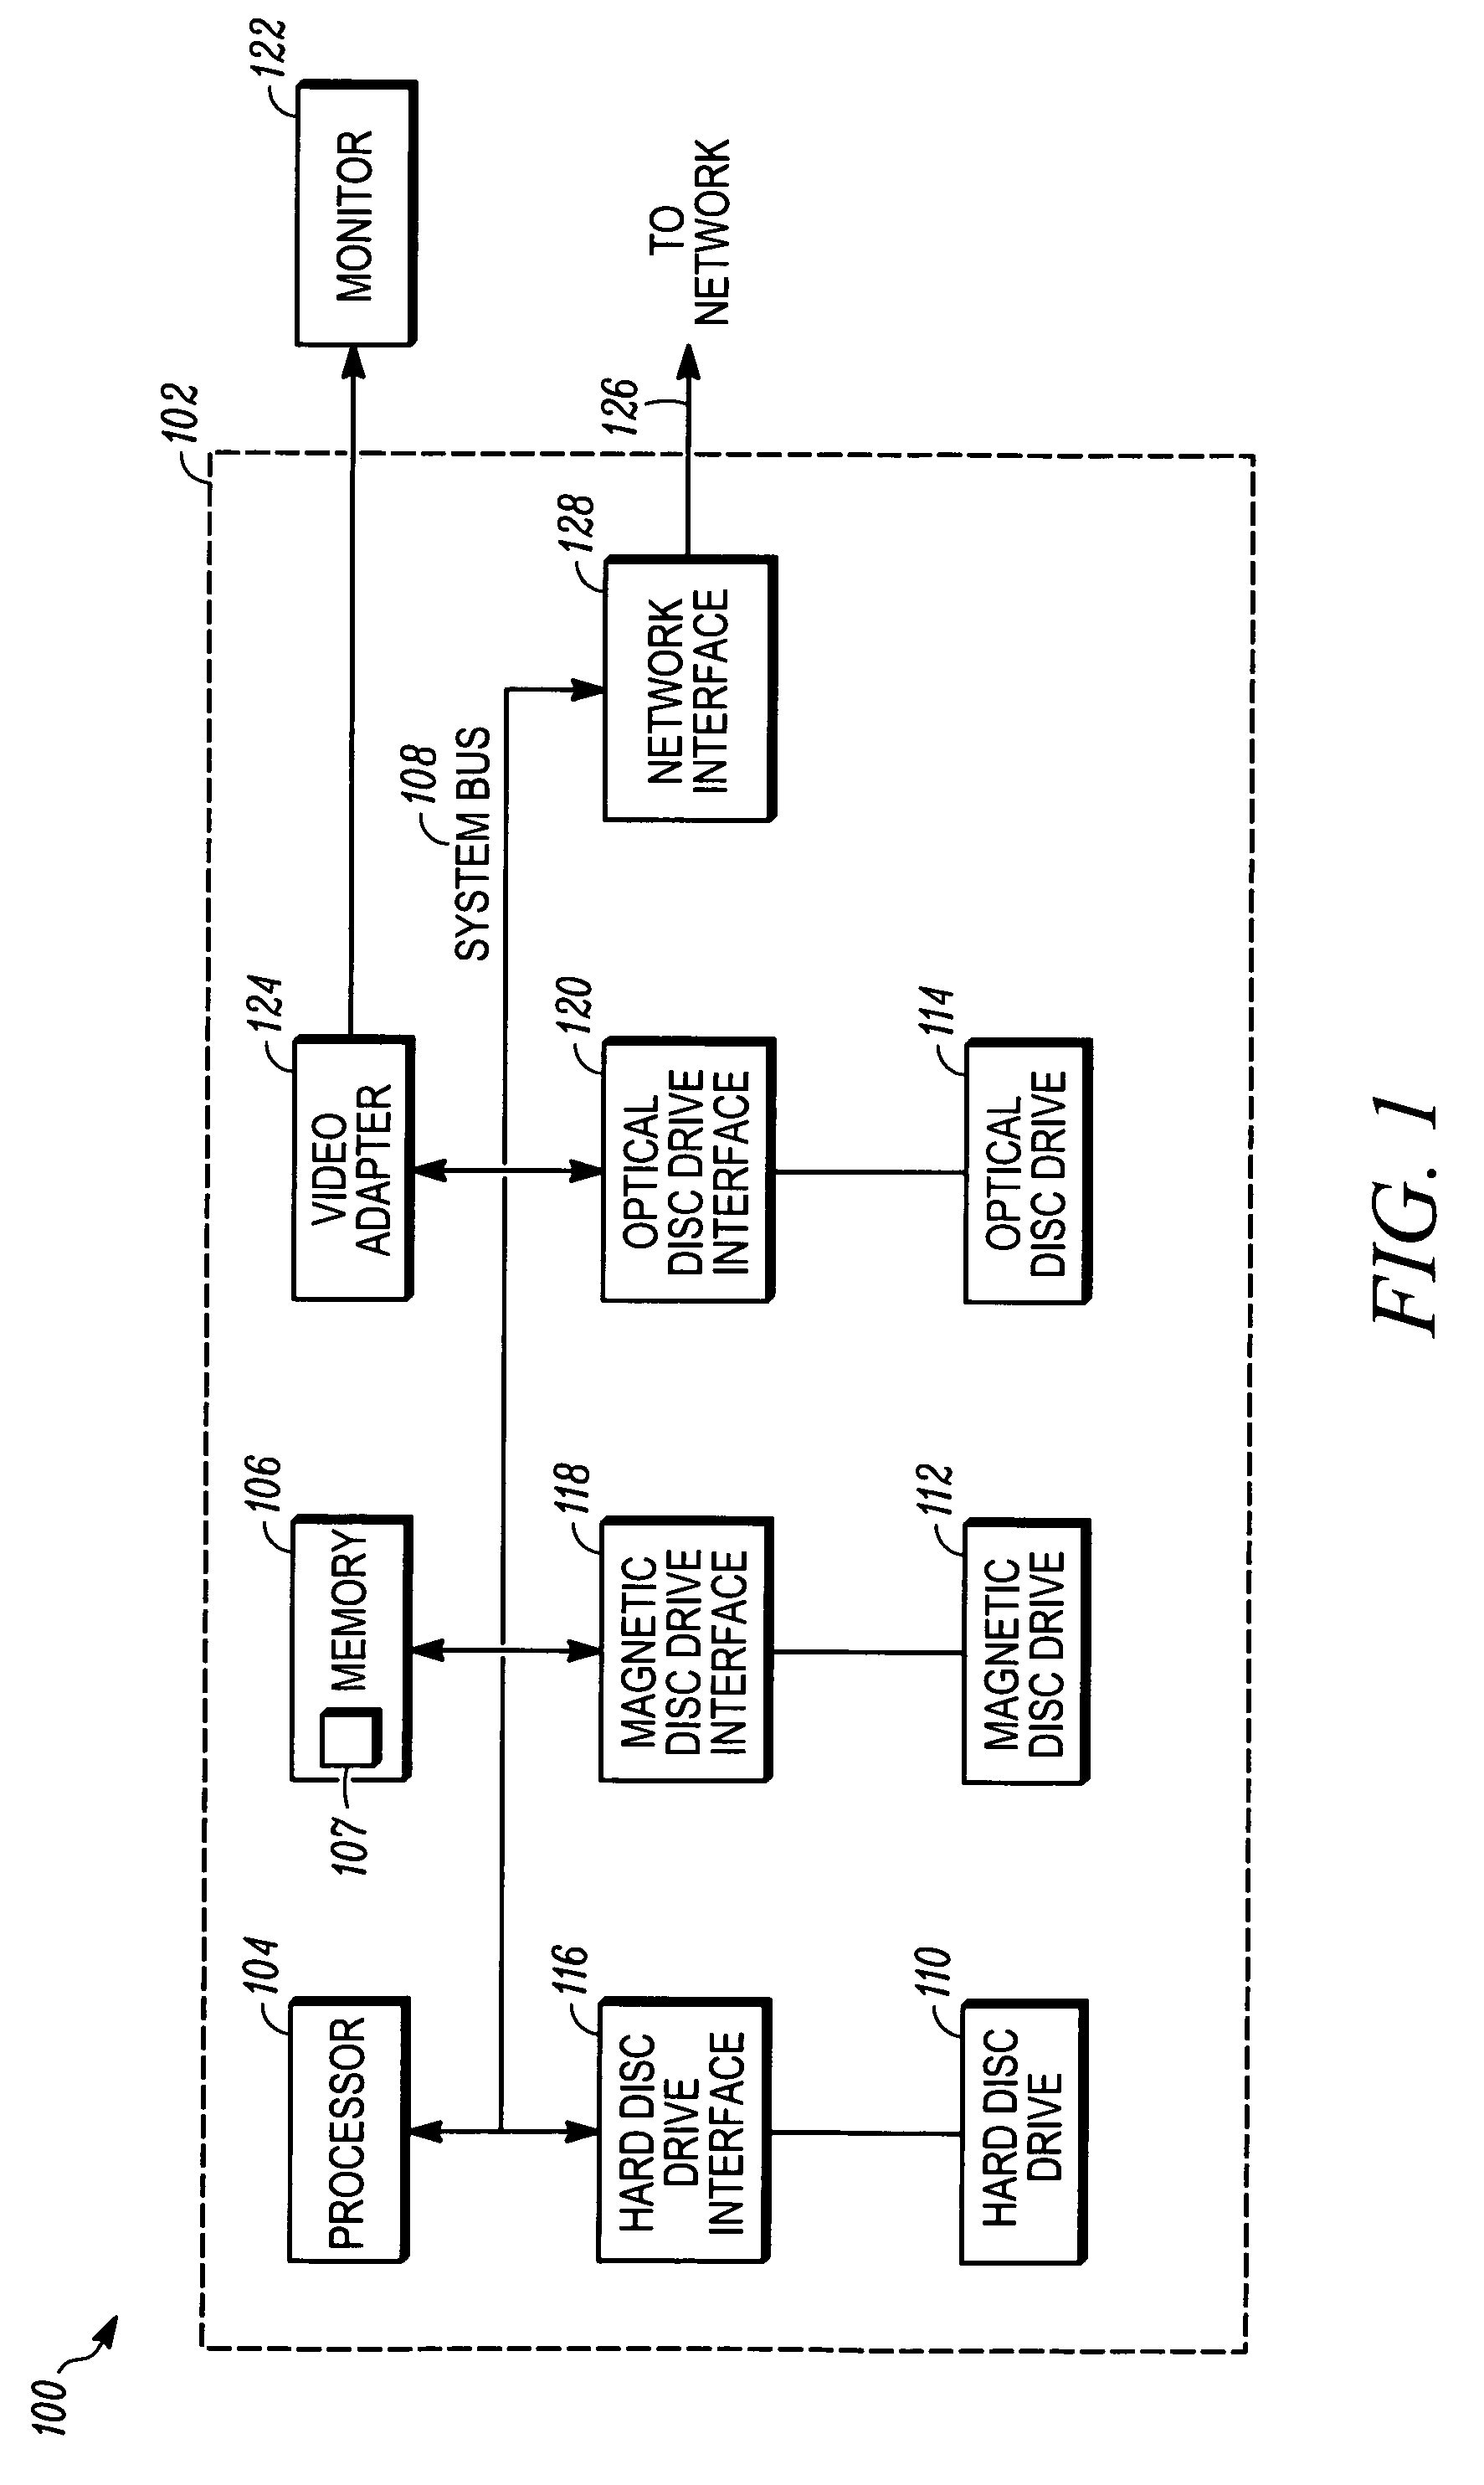
[0026]FIG. 1 illustrates a block diagram of a data-processing apparatus 100, which can be utilized to implement a preferred embodiment. Data-processing apparatus 100 can implement the present invention as described in greater detail herein. Data-processing apparatus 100 can be configured as a general purpose computing device, such as a computer 102. The data-processing apparatus 100 generally includes a processing unit 104, a memory 106, and a system bus 108 that operatively couples the various system components to the processing unit 104. One or more processing units 104 operate as either a single central processing unit (CPU) or a parallel processing environment.

[0027]The data-processing apparatus 100 further includes one or more data storage devices for storing and ...


PUM


Abstract

A computer implemented method, system and program product for automatic fault classification. A set of abnormal data can be automatically grouped based on sensor contribution to a prediction error. A principal component analysis (PCA) model of normal behavior can then be applied to a set of newly generated data, in response to automatically grouping the set of abnormal data based on the sensor contribution to the prediction error. Data points can then be identified, which are indicative of abnormal behavior. Such an identification step can occur in response to applying the principal component analysis mode of normal behavior to the set of newly generated data in order to cluster and classify the data points in order to automatically classify one or more faults thereof. The data points are automatically clustered, in order to identify a set of similar events, in response to identifying the data points indicative of abnormal behavior.

Description

TECHNICAL FIELD[0001]Embodiments are generally related to data-processing systems and methods. Embodiments are also related to automatic fault classification and principal component analysis (PCA).BACKGROUND[0002]Early event detection (EED) systems are designed to assist the operations team by providing early warnings of approaching process upsets. EED systems use multivariate statistics and pattern recognition algorithms to monitor continuous time-series data to provide early warning of operational shifts that may drive a system into a hazardous state. The core of an EED system is a set of state estimators that embed monitoring algorithms. These algorithms use time series process data to assess the health of the monitored process. Although numerous state estimators exist, such as Principal Component Analysis (PCA), that are able to detect abnormality, the challenge lies in the translation of their output into information that is meaningful to the process operator. Currently, EED sy...

Claims


Application Information

Patent Timeline
Patent Type & Authority Patents(United States)
IPC IPC(8): G06E1/00G06E3/00G06F15/18G06G7/00
CPCG05B23/0254G05B23/0281G06K9/622G06F18/232
Inventor GURALNIK, VALERIEFOSLIEN, WENDY K.
Owner HONEYWELL INT INC
Why Eureka
Try Eureka