System and method for predicting chromosomal regions that control phenotypic traits

a chromosomal region and prediction system technology, applied in the field of system and method for predicting chromosomal regions that control phenotypic traits, can solve the problems of difficult identification of common disease susceptibility loci, hampered mapping of disease susceptibility genes in human populations, and relatively limited progress in identifying genetic susceptibility loci for complex diseases using murine models

Inactive Publication Date: 2010-04-13
THE BOARD OF TRUSTEES OF THE LELAND STANFORD JUNIOR UNIV
View PDF9 Cites 8 Cited by
  • Summary
  • Abstract
  • Description
  • Claims
  • Application Information

AI Technical Summary

Benefits of technology

[0010]The present invention provides a system and method for associating a phenotype with one or more candidate chromosomal regions in the genome of an organism. In the method, phenotypic differences between a plurality of strains of the organism are correlated with variations and/or similarities in the respective genomes of the plurality of strains of the organism. The invention relies on the use of a genotypic database

Problems solved by technology

Since multiple genetic loci are involved, and each individual locus makes a small contribution to overall disease susceptibility, it will be quite difficult to identify common disease susceptibility loci by applying conventional linkage and positional cloning methods to human populations.
Mapping of disease susceptibility genes in human populations has also been hampered by variability in phenotype, genetic heter

Method used


Image

  • System and method for predicting chromosomal regions that control phenotypic traits
  • System and method for predicting chromosomal regions that control phenotypic traits
  • System and method for predicting chromosomal regions that control phenotypic traits

Examples


example 1

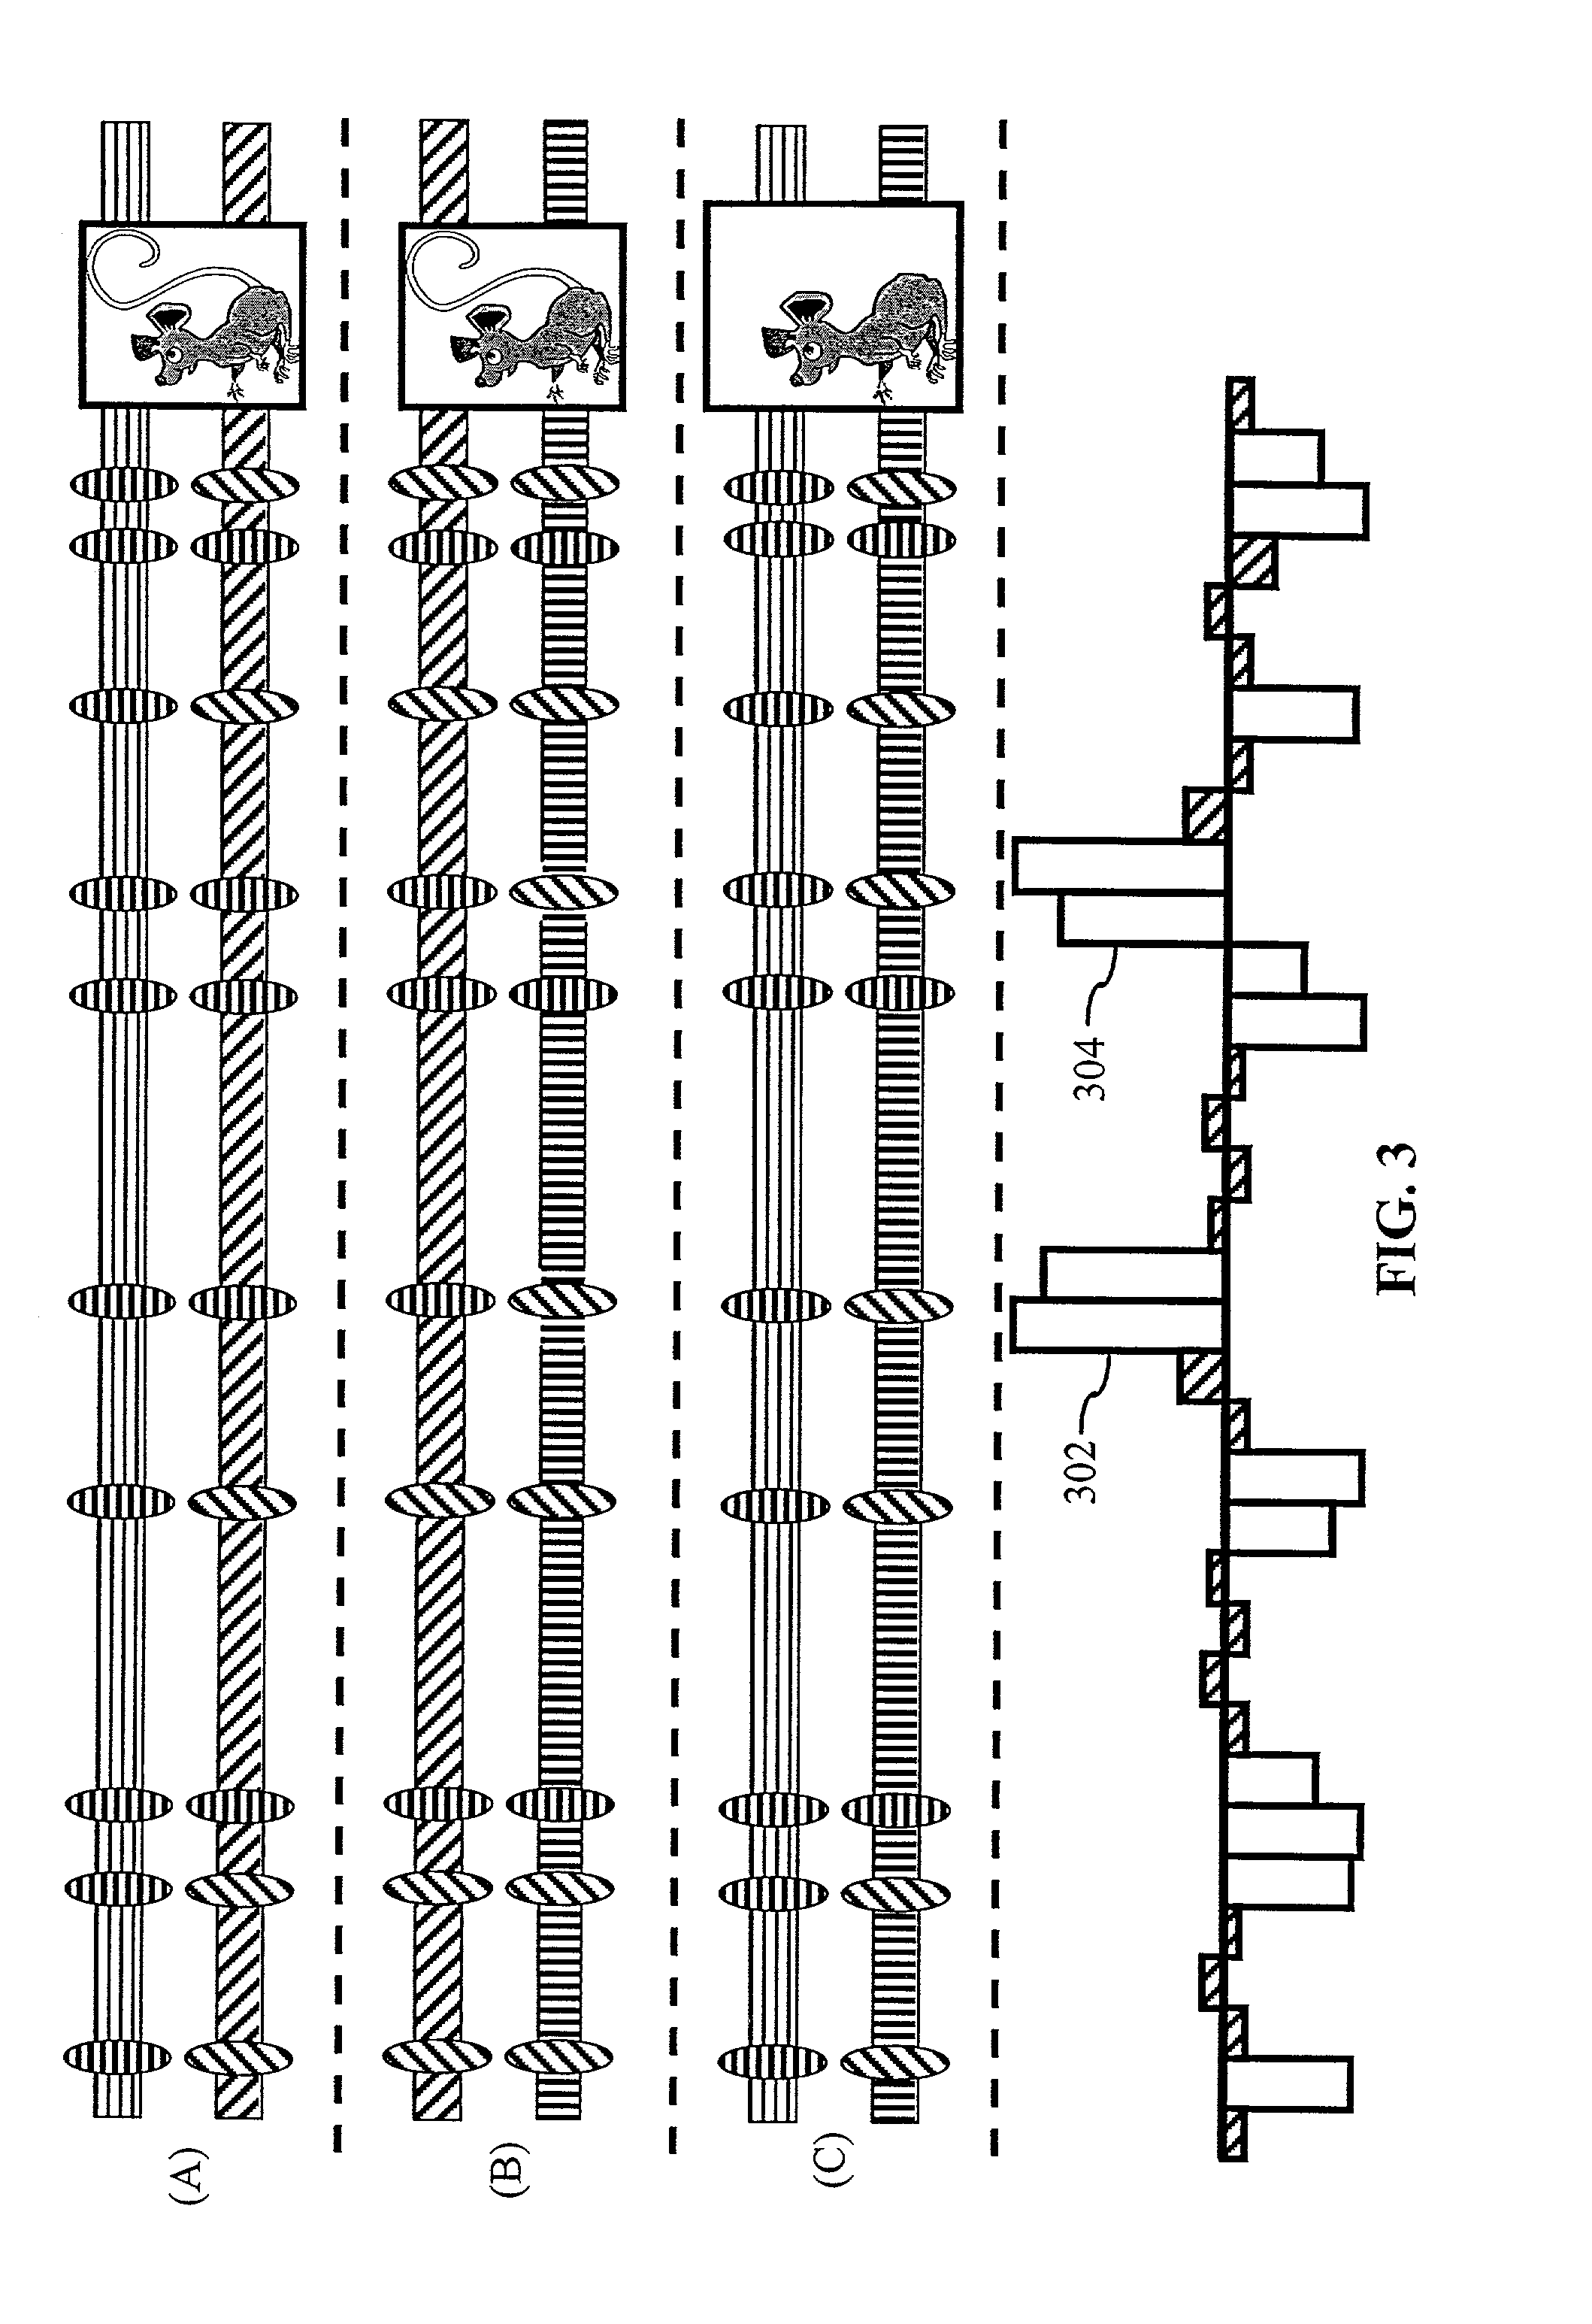
[0153]Hypothetical example of the method for prediction of QTL regions. To aid in the understanding of the methods of the present invention, FIG. 3 is provided. FIG. 3 shows hypothetical comparisons, in accordance with the methods of the present invention, between three mouse strains (A, B, C) using SNP information found in the murine SNP database. Each of the two chromosomes sets for a given mouse strain is represented by a horizontal box along the horizontal axis of FIG. 3. Each chromosome set is characterized by the hatching type (horizontal, diagonal, and vertical). Chromosomes with the same hatching style in each of the mouse strains are identical. Cross hatched or diagonally hatched ovals respectively represent alleles at specific chromosomal positions. A dashed horizontal line is used to differentiate each of the mouse strains and the accompanying chart at the bottom of FIG. 3.

[0154]In the hypothetical example provided in FIG. 3, two of the three strains, (A) and (B), exhibit...

example 2

[0156]Predicting the chromosomal location of the MHC complex. The methods of the present invention were used to predict the chromosomal location of the MHC complex, which has been mapped to murine chromosome 17, using the H2 haplotypes for the MHC K locus for 10 inbred strains (Anonymous, JAX Notes 475, 1998). Phenotypic distances for strains that shared a haplotype were set to zero, and a distance of one was used for strains of different haplotypes. The SNPs within and near the MHC region had a genotypic distribution which was highly correlated with the phenotypic distances; the correlation value for interval 440 (FIG. 4A) was 5.35 standard deviations above the average for all loci analyzed. There were no other peaks throughout the mouse genome that exhibited a comparable correlation with the phenotype. The computational analysis, executed in accordance with the methods of the present invention, excluded 96% of the mouse genome from consideration without missing the genomic region ...

example 3

[0157]Identification of the QTLs that correspond to allergic asthma. The chromosomal positions that regulate susceptibility to experimental allergic asthma have been investigated using prior art techniques. For example, published analyses of intercross progeny between susceptible (A / J) and resistant (C3H / HeJ) mouse strains identified QTL intervals on chromosomes 2 and 7 (Ewart, et al., Am J Respir Cell Mol Biol 23, 537-545, 2000; Karp, et al., Nature Immunology 1, 221-226, 2000). The ability of the methods of the present invention to identify these chromosomal regions was investigated.

[0158]The phenotypic distance used to populate the phenotypic matrix was the absolute difference between the measured airway response after allergen-challenge for each strain pair. The experimentally identified QTL intervals on chromosomes 2 and 7 were among the strongest peaks identified by the methods of the present invention (FIG. 4B). The computational method excluded 80% of the mouse genome from c...


PUM

PropertyMeasurementUnit
Volumeaaaaaaaaaa
Volumeaaaaaaaaaa
Volumeaaaaaaaaaa

Abstract

A method of associating a phenotype with one or more candidate chromosomal regions in a genome of an organism includes the step of deriving a phenotypic data structure that represents differences in phenotypes between different strains of the organism. Further, a genotypic data structure is established. The genotypic data structure corresponds to a locus selected from a plurality of loci in the genome of the organism. The genotypic data structure represents variations of at least one component of the locus between different strains of the organism. The phenotypic data structure is compared to the genotypic data structure to form a correlation value. The process of establishing a genotypic data structure and comparing it to the phenotypic data structure is repeated for each locus in the plurality of loci, thereby identifying one or more genotypic data structures that form a high correlation value relative to all other compared genotypic data structures. The loci that correspond to the one or more genotypic data structures having a high correlation value represent the one or more candidate chromosomal regions.

Description

CROSS REFERENCE TO RELATED APPLICATION[0001]This application is a continuation-in-part of U.S. application Ser. No. 09 / 737,918, filed Dec. 15, 2000, which is incorporated by reference herein in its entirety.COMPUTER PROGRAM LISTING APPENDIX[0002]One compact disc that includes a Computer Program Listing Appendix has been submitted in duplicate in the present application. The size of the files contained in the Computer Program Listing Appendix, their date of creation, their time of creation, and their name are found in Table 1 below. In Table 1, each row represents a file or directory. If the row represents a directory, the designation “<DIR>” is provided in column one. If the row represents a file, the size of the file in bytes is provided in column one. Columns two and three respectively represent the date and time of file or directory creation while the fourth column represents the name of the file or directory.[0003]TABLE 1Table 1. Contents of the Computer Program Listing Ap...

Claims


Application Information

Patent Timeline
IPC IPC(8): G06G7/48G01N31/00G01N33/48G06G7/58G06F17/30G16B20/20C12Q1/68
CPCG06F19/18C12Q1/6876G16B20/00G16B20/20
Inventor USUKA, JONATHAN A.GRUPE, ANDREWPELTZ, GARY ALLEN
Owner THE BOARD OF TRUSTEES OF THE LELAND STANFORD JUNIOR UNIV
Why Eureka
Try Eureka