Generating self-checking test cases from reduced case analysis graphs

a graph and graph technology, applied in the field of design under test testing, can solve the problems of double-expanding growth rate of verification complexity, exponential growth of verification complexity, and exponential growth of complexity of functional testing or verifying digital systems

Active Publication Date: 2010-08-17
BREKER VERIFICATION SYST
View PDF38 Cites 19 Cited by
  • Summary
  • Abstract
  • Description
  • Claims
  • Application Information

AI Technical Summary

Problems solved by technology

The complexity of functionally testing a system grows exponentially with the number of state bits (e.g., doubling the number of state bits implies that there are four times as many possible states to be tested).
Thus, the complexity of functionally testing or verifying a digital system has a growth rate that is doubly exponential.
Growth in verification complexity has been empirically observed as the number of pre-silicon logic bugs in semiconductor chips increases exponentially at a rate of 3-4 times per product generation.
Currently, functional verification can consume up to 70% of design effort and is typically a critical path in product development cycles.
Today, the majority of silicon re-spins of semiconductor products are due to logic bugs, with each spin adding significant delay and expense to project development.
Logic bugs occur due to bug escapes in a verification process, and are caused by failure to test a bug scenario that led to the problem.
Lack of quality in a verification process can be traced to four primary causes of bug escapes.
First, comprehensive test plans are difficult to write, and a bug scenario might not have been considered in the test plan.
Second, it can be difficult to create test cases that cover the large number of scenarios to be considered.
A bug scenario might have been considered in a test plan, but there might have been insufficient time and resources to create a test case for the bug scenario.
Third, there are difficulties in measuring coverage of scenarios that have been tested, and a failure to hit the bug scenario may not have been detected.
Finally, inefficient use of compute resources may mean that a verification process never reached the test case for the bug scenario.
Creating a test plan that considers all scenarios to be tested is a difficult process.
Further, with this approach it is difficult to explici...

Method used


Image

  • Generating self-checking test cases from reduced case analysis graphs
  • Generating self-checking test cases from reduced case analysis graphs
  • Generating self-checking test cases from reduced case analysis graphs

Examples


Embodiment Construction

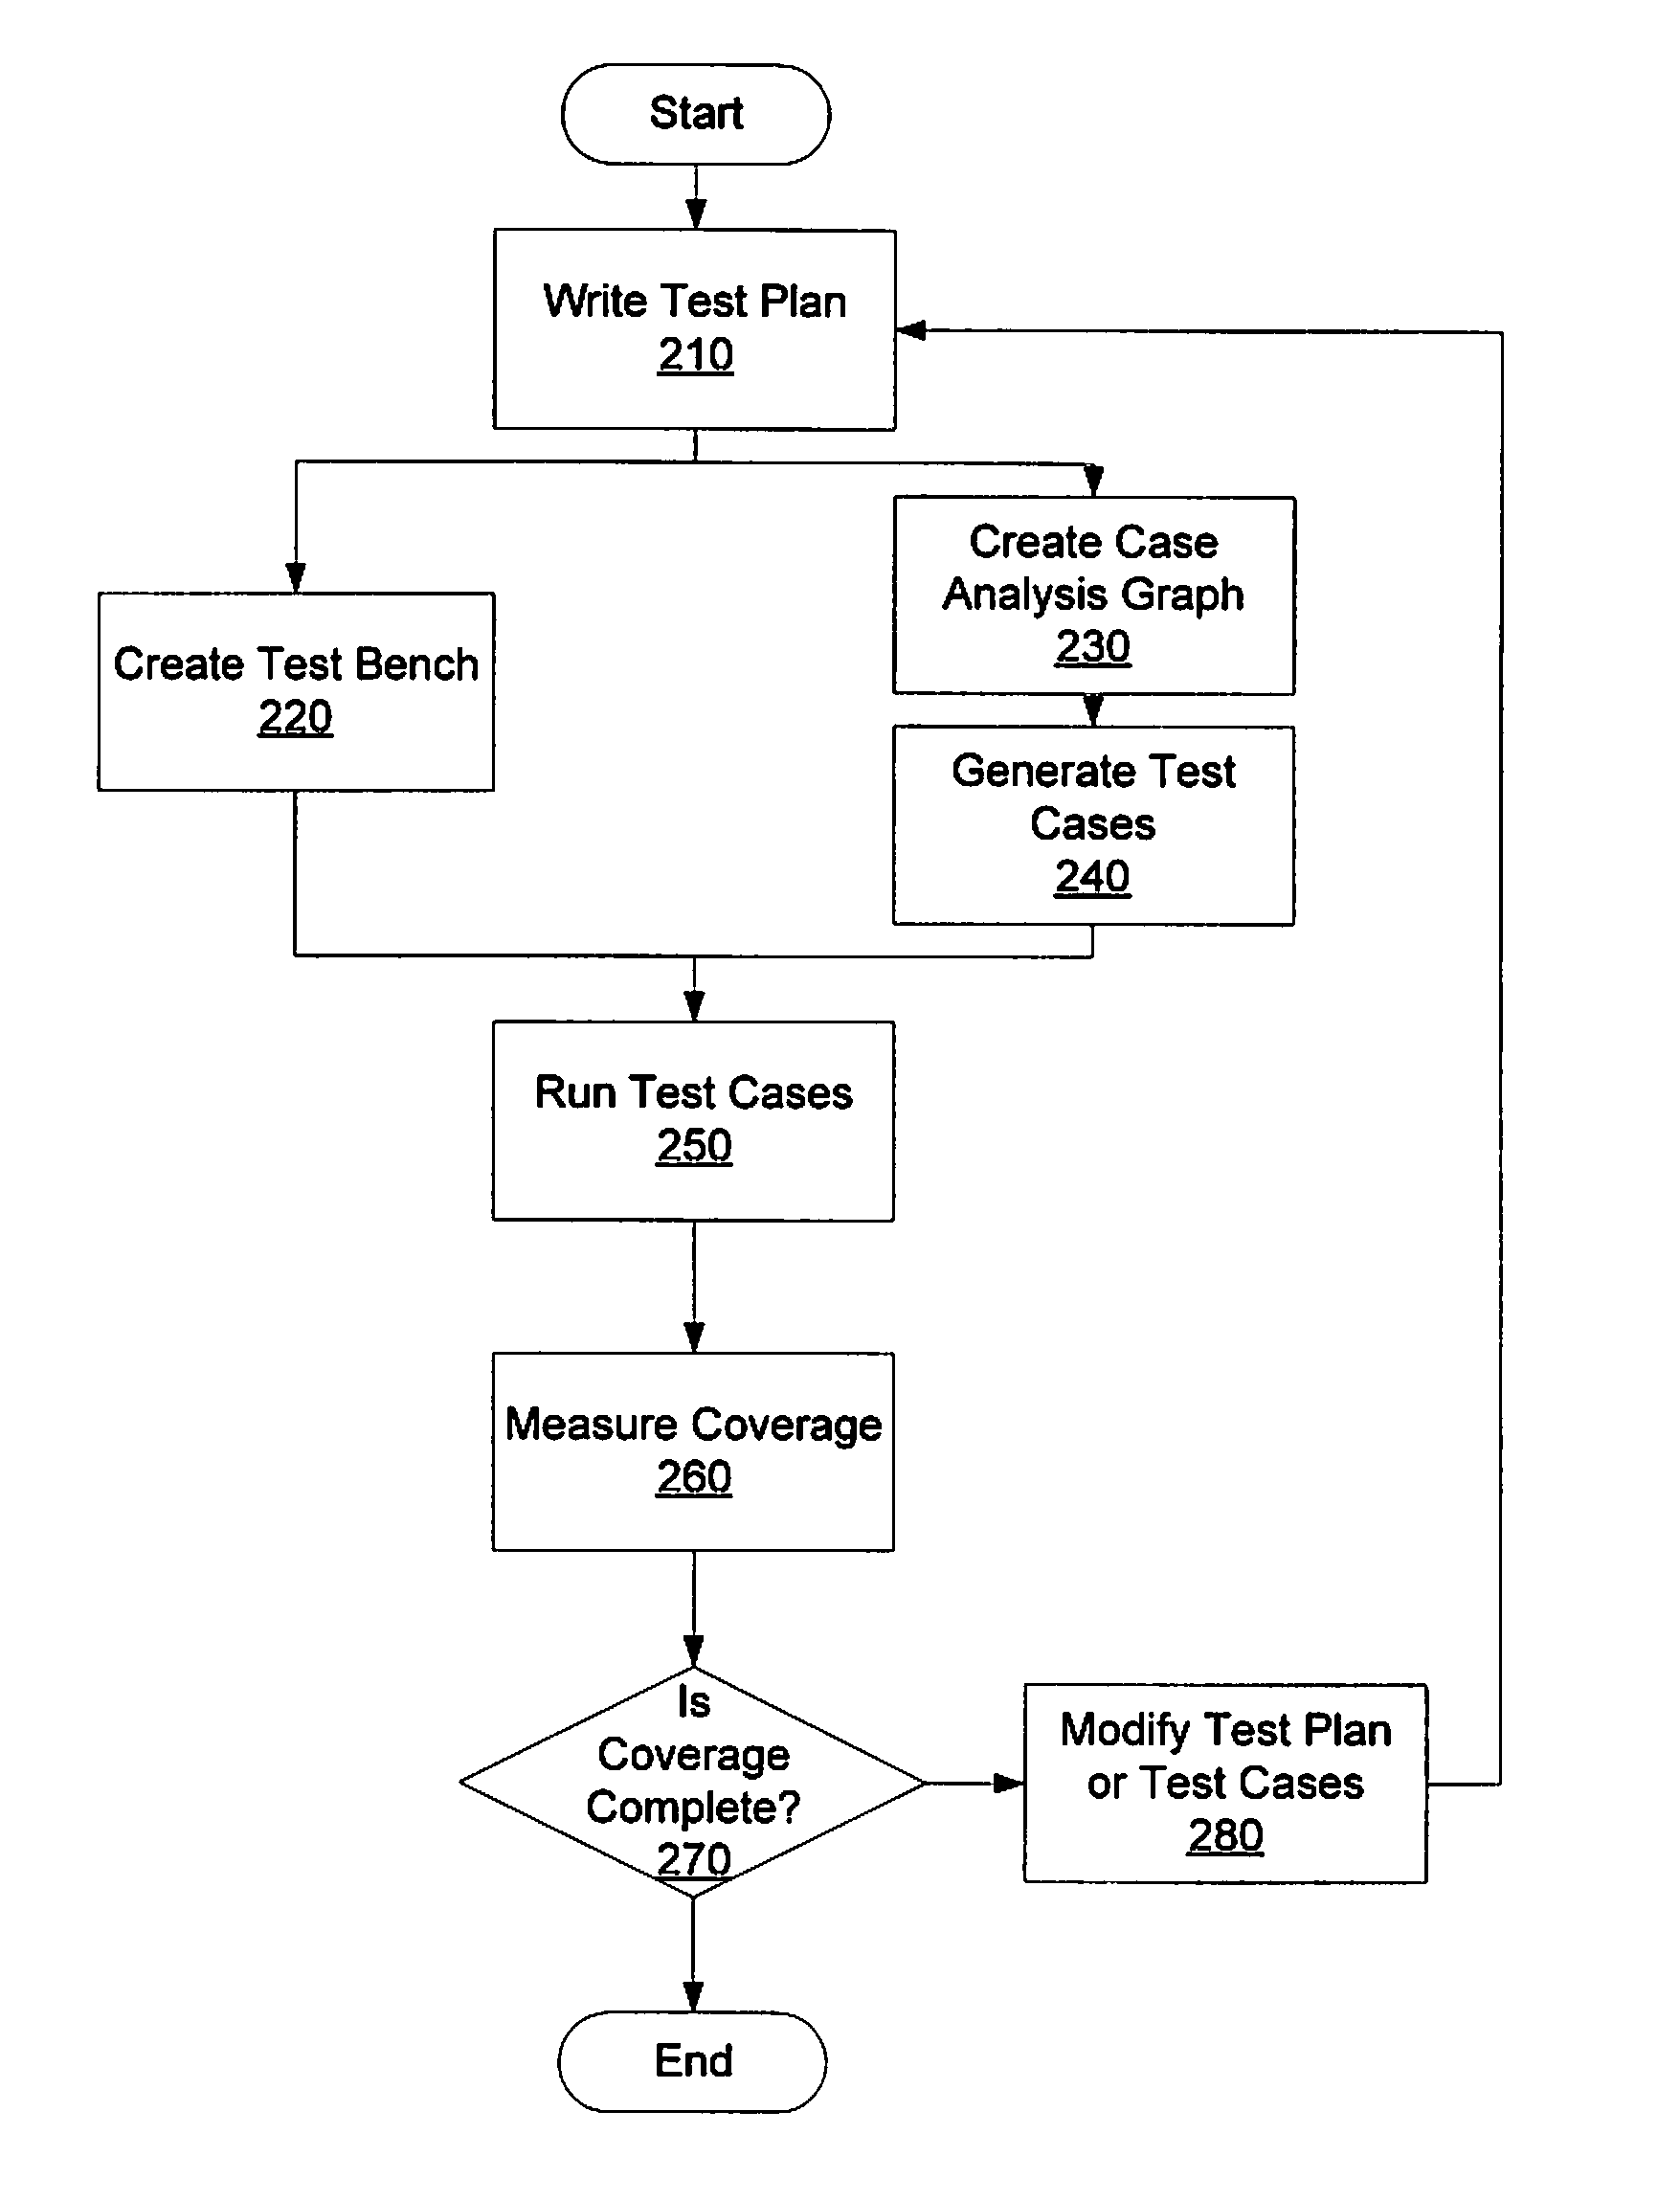
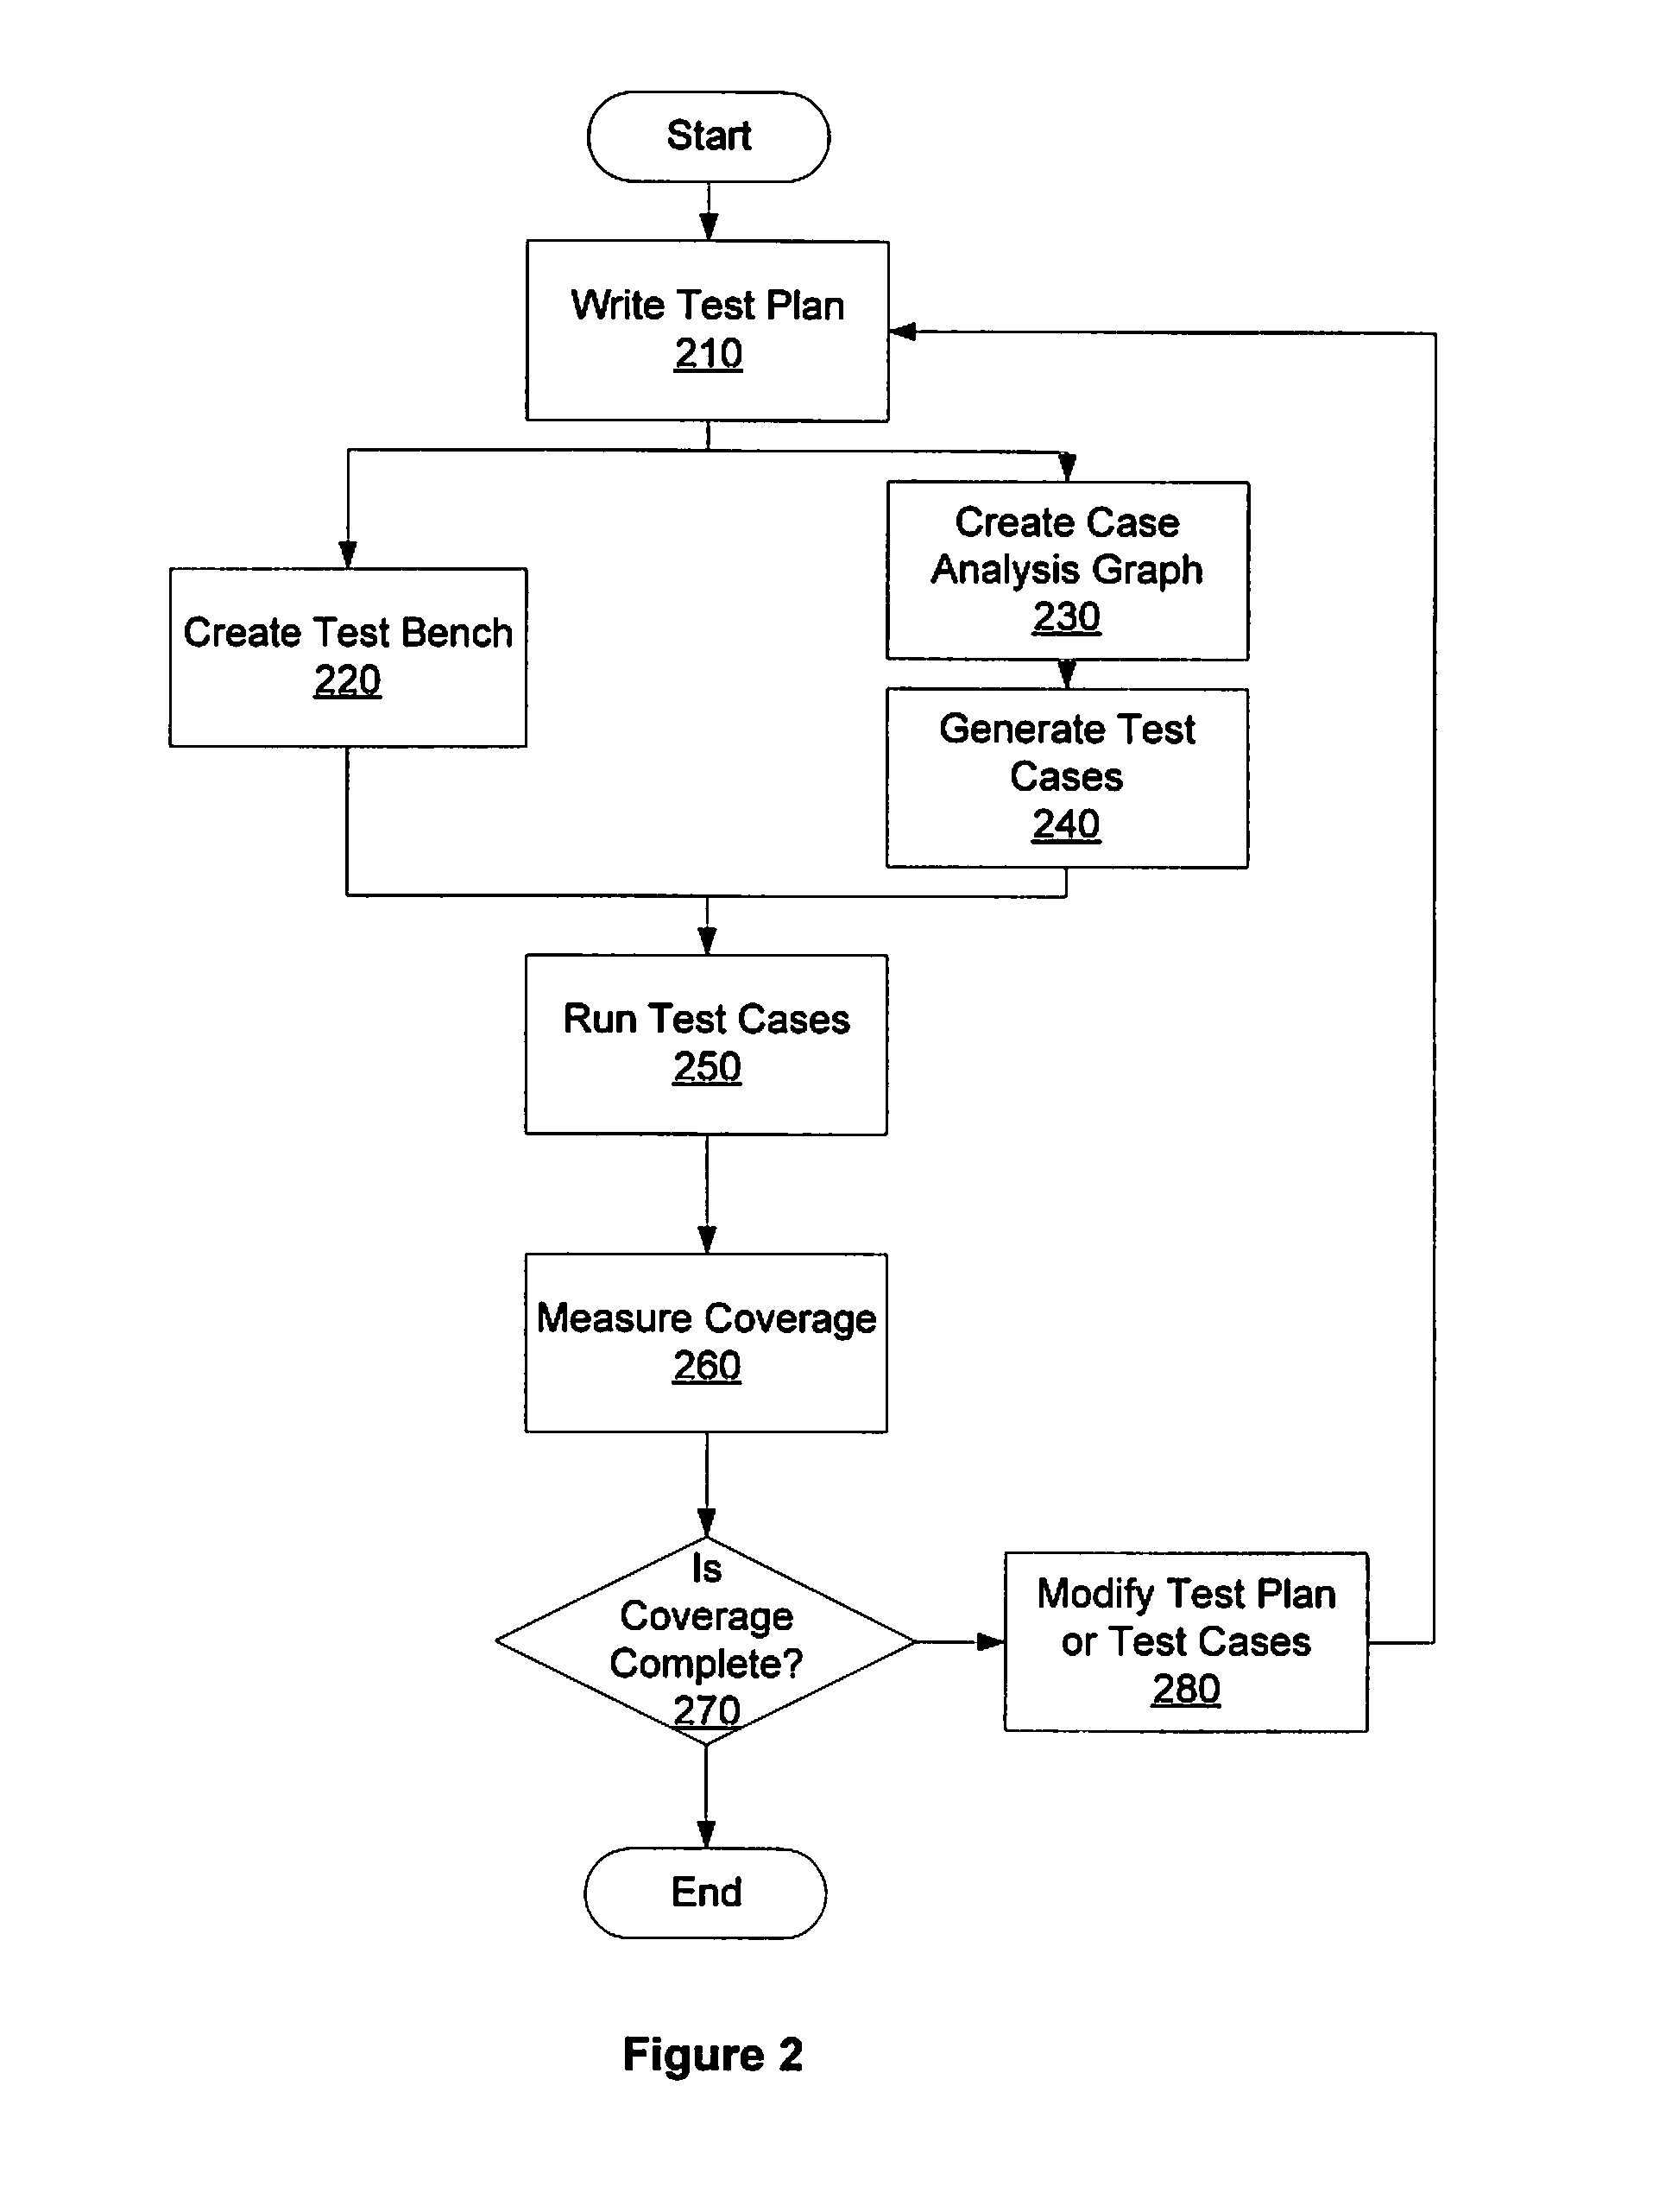
[0024]The present invention provides a method, system and apparatus for constructing a comprehensive test plan using a case analysis graph. Embodiments of the present invention further provide for automatically generating test cases from a case analysis graph and for measuring functional coverage of the test cases. Additional embodiments of the present invention provide for visualizing both the comprehensive test plan and functional coverage data.

Typical Verification Process

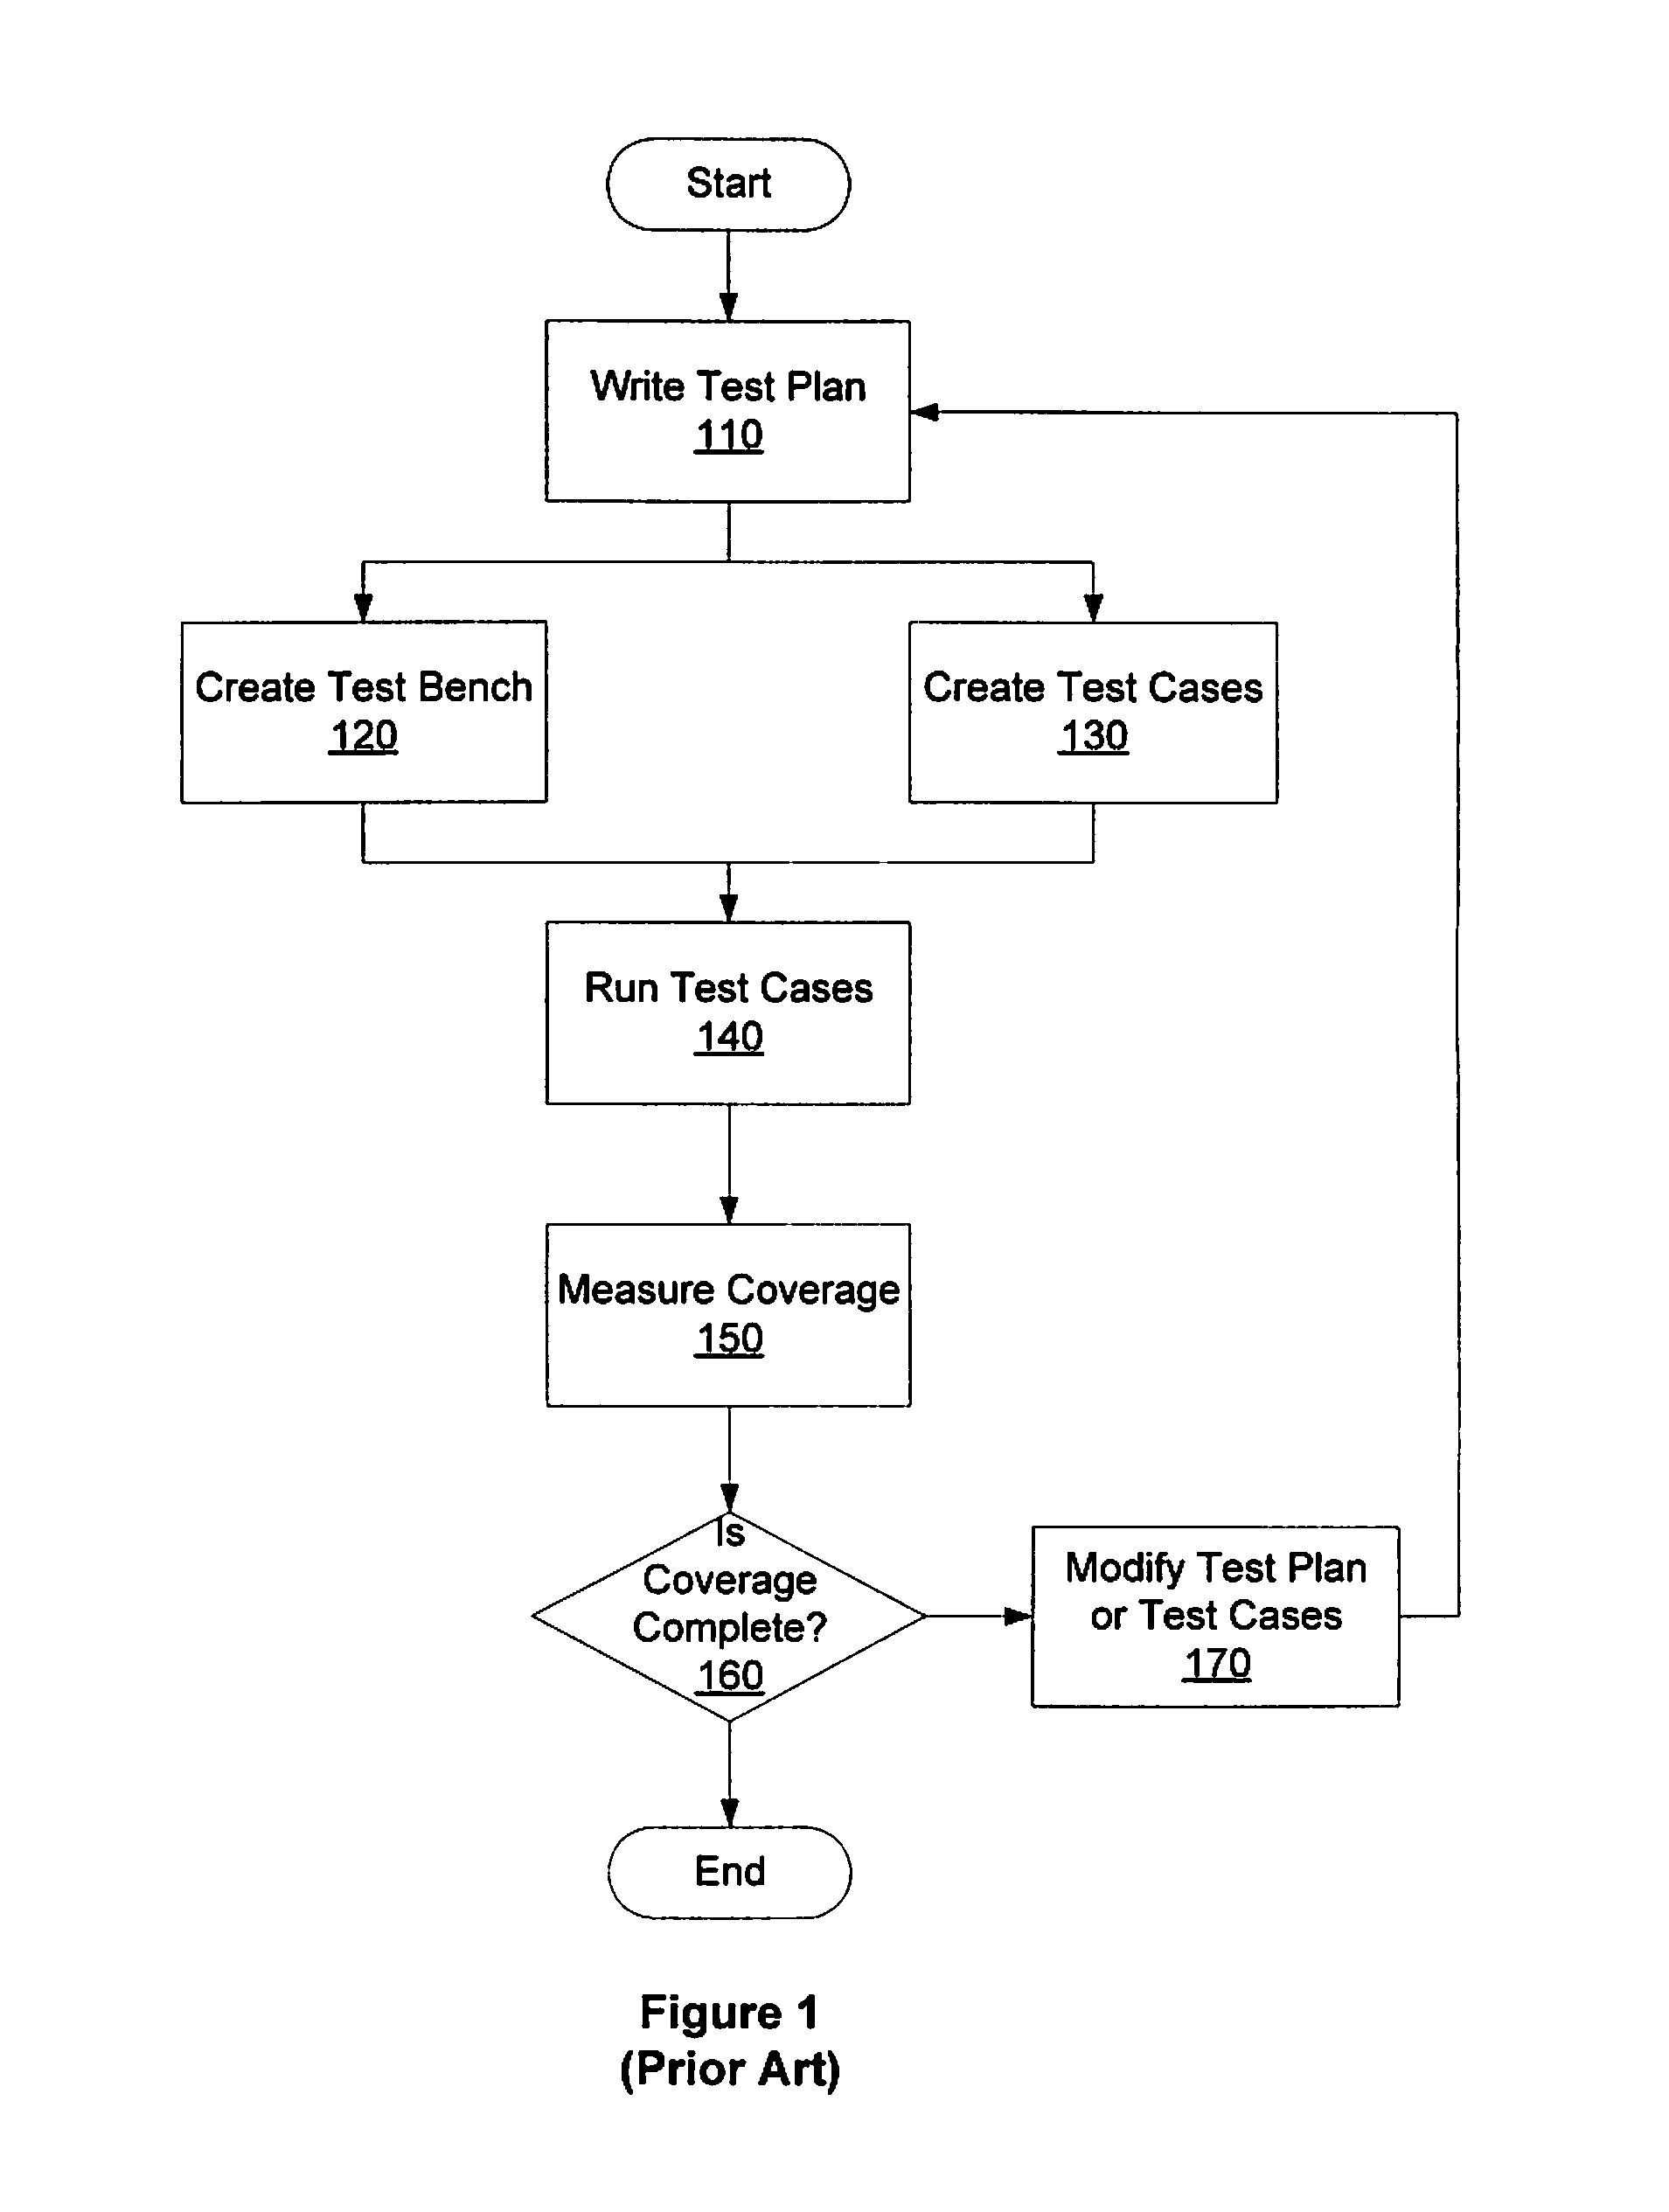
[0025]FIG. 1 is a simplified flow diagram illustrating a typical prior art process followed in functional verification. Initially, a test plan is written to define the scenarios to be tested for a design under test (110). A test bench is developed that allows test cases to be exercised on the design under test (120). Test cases are created to test each of the scenarios defined in the test plan (130). Each test case is directed toward a scenario of interest and should predict an expected result. Each test case is ...


PUM


Abstract

A method, system and apparatus for constructing a comprehensive test plan using a case analysis graph is provided. Embodiments of the present invention further provide for automatically generating test cases from a case analysis graph and for measuring functional coverage of the test cases. Additional embodiments of the present invention provide for visualizing both the comprehensive test plan and functional coverage data.

Description

CROSS-REFERENCES TO RELATED APPLICATIONS[0001]This invention claims priority from Provisional Patent Application Ser. No. 60 / 848,222, entitled “HIERARCHICAL TEST CASE SYNTHESIS,” filed Sep. 29, 2006, and naming Adnan A. Hamid as inventor. This provisional patent application is incorporated herein by reference in its entirety and for all purposes.FIELD OF THE INVENTION[0002]The present invention relates to the testing of designs under test, for example electronic systems, and, more particularly, to a method and apparatus for automatically generating tests for a design under test.BACKGROUND OF THE INVENTION[0003]Moore's Law states that the growth rate of transistors per chip is exponential. Assuming that a fraction of these transistors being used to create state bits (e.g., latches, flip-flops or other memory elements) has remained constant, it follows that the growth rate of state bits in digital systems is also exponential. The complexity of functionally testing a system grows expon...

Claims


Application Information

Patent Timeline
IPC IPC(8): G06F17/50
CPCG06F11/263G06F11/3676G06F11/3684
Inventor HAMID, ADNAN A.FLATAU, ARTHUR D.
Owner BREKER VERIFICATION SYST
Why Eureka
Try Eureka