Utility monitoring and disaggregation systems and methods of use

a technology of utility costs and monitoring systems, applied in the field of utility monitors, can solve the problems of poor decision-making by individuals, disconnect between the perception of utility costs and their actual costs, and the system's limited ability to promote conservation, etc., and achieve the effect of convenient, accurate and accurate attribution

Inactive Publication Date: 2011-02-08
BOARD OF RGT NEVADA SYST OF HIGHER EDUCATION ON BEHALF OF THE DESERT RES INST
View PDF21 Cites 65 Cited by
  • Summary
  • Abstract
  • Description
  • Claims
  • Application Information

AI Technical Summary

Benefits of technology

[0017]The disclosed methods, systems, and apparatus can allow users to receive data regarding utility consumption relatively concurrently with such use. The availability of such data can better aid users in adjusting their utility use. In a particular example, consumption data is converted to an estimate of the environmental impacts of the utility consumption, such as an estimate of greenhouse gas emissions. The present disclosure can also allow utility consumption to be more easily, conveniently, and accurately attributed to various sources of consumption. In particular methods, the present disclosure allows the thermal efficiency of a monitored area to be measured. Such measurements can be used to help guide purchasing or renovation decisions for the monitored area.

Problems solved by technology

This system has limited ability to promote conservation since the consumer does not have feedback to associate their specific activities to a particular cost.
This lack of information can result in a disconnect between the perception of utility costs and their actual costs.
The lack of timely and / or specific information can also lead to inefficiencies and poor decision making by individuals.
This technology has not penetrated the small business and residential market due to the system and installation expense.
Moreover, the data provided by typical existing systems is not presented in a way that non-technical users can understand.
Existing monitoring systems also typically do not monitor multiple utilities (i.e. natural gas, electric power, and water), or correlate the use of different utilities to one another.
However, attaching sensors and transmitters to numerous appliances in the areas to be monitored can add substantial cost to the system.
Such a configuration can also increase the complexity of the system and the difficulty of installing it.

Method used


Image

  • Utility monitoring and disaggregation systems and methods of use
  • Utility monitoring and disaggregation systems and methods of use
  • Utility monitoring and disaggregation systems and methods of use

Examples


Embodiment Construction

[0032]As used herein, the singular forms “a,”“an,” and “the” refer to one or more than one, unless the context clearly dictates otherwise. As used herein, the term “includes” means “comprises.” Unless the context clearly indicates otherwise, the disjunctive “or” includes the conjunctive “and.”

[0033]Utility Monitoring Systems

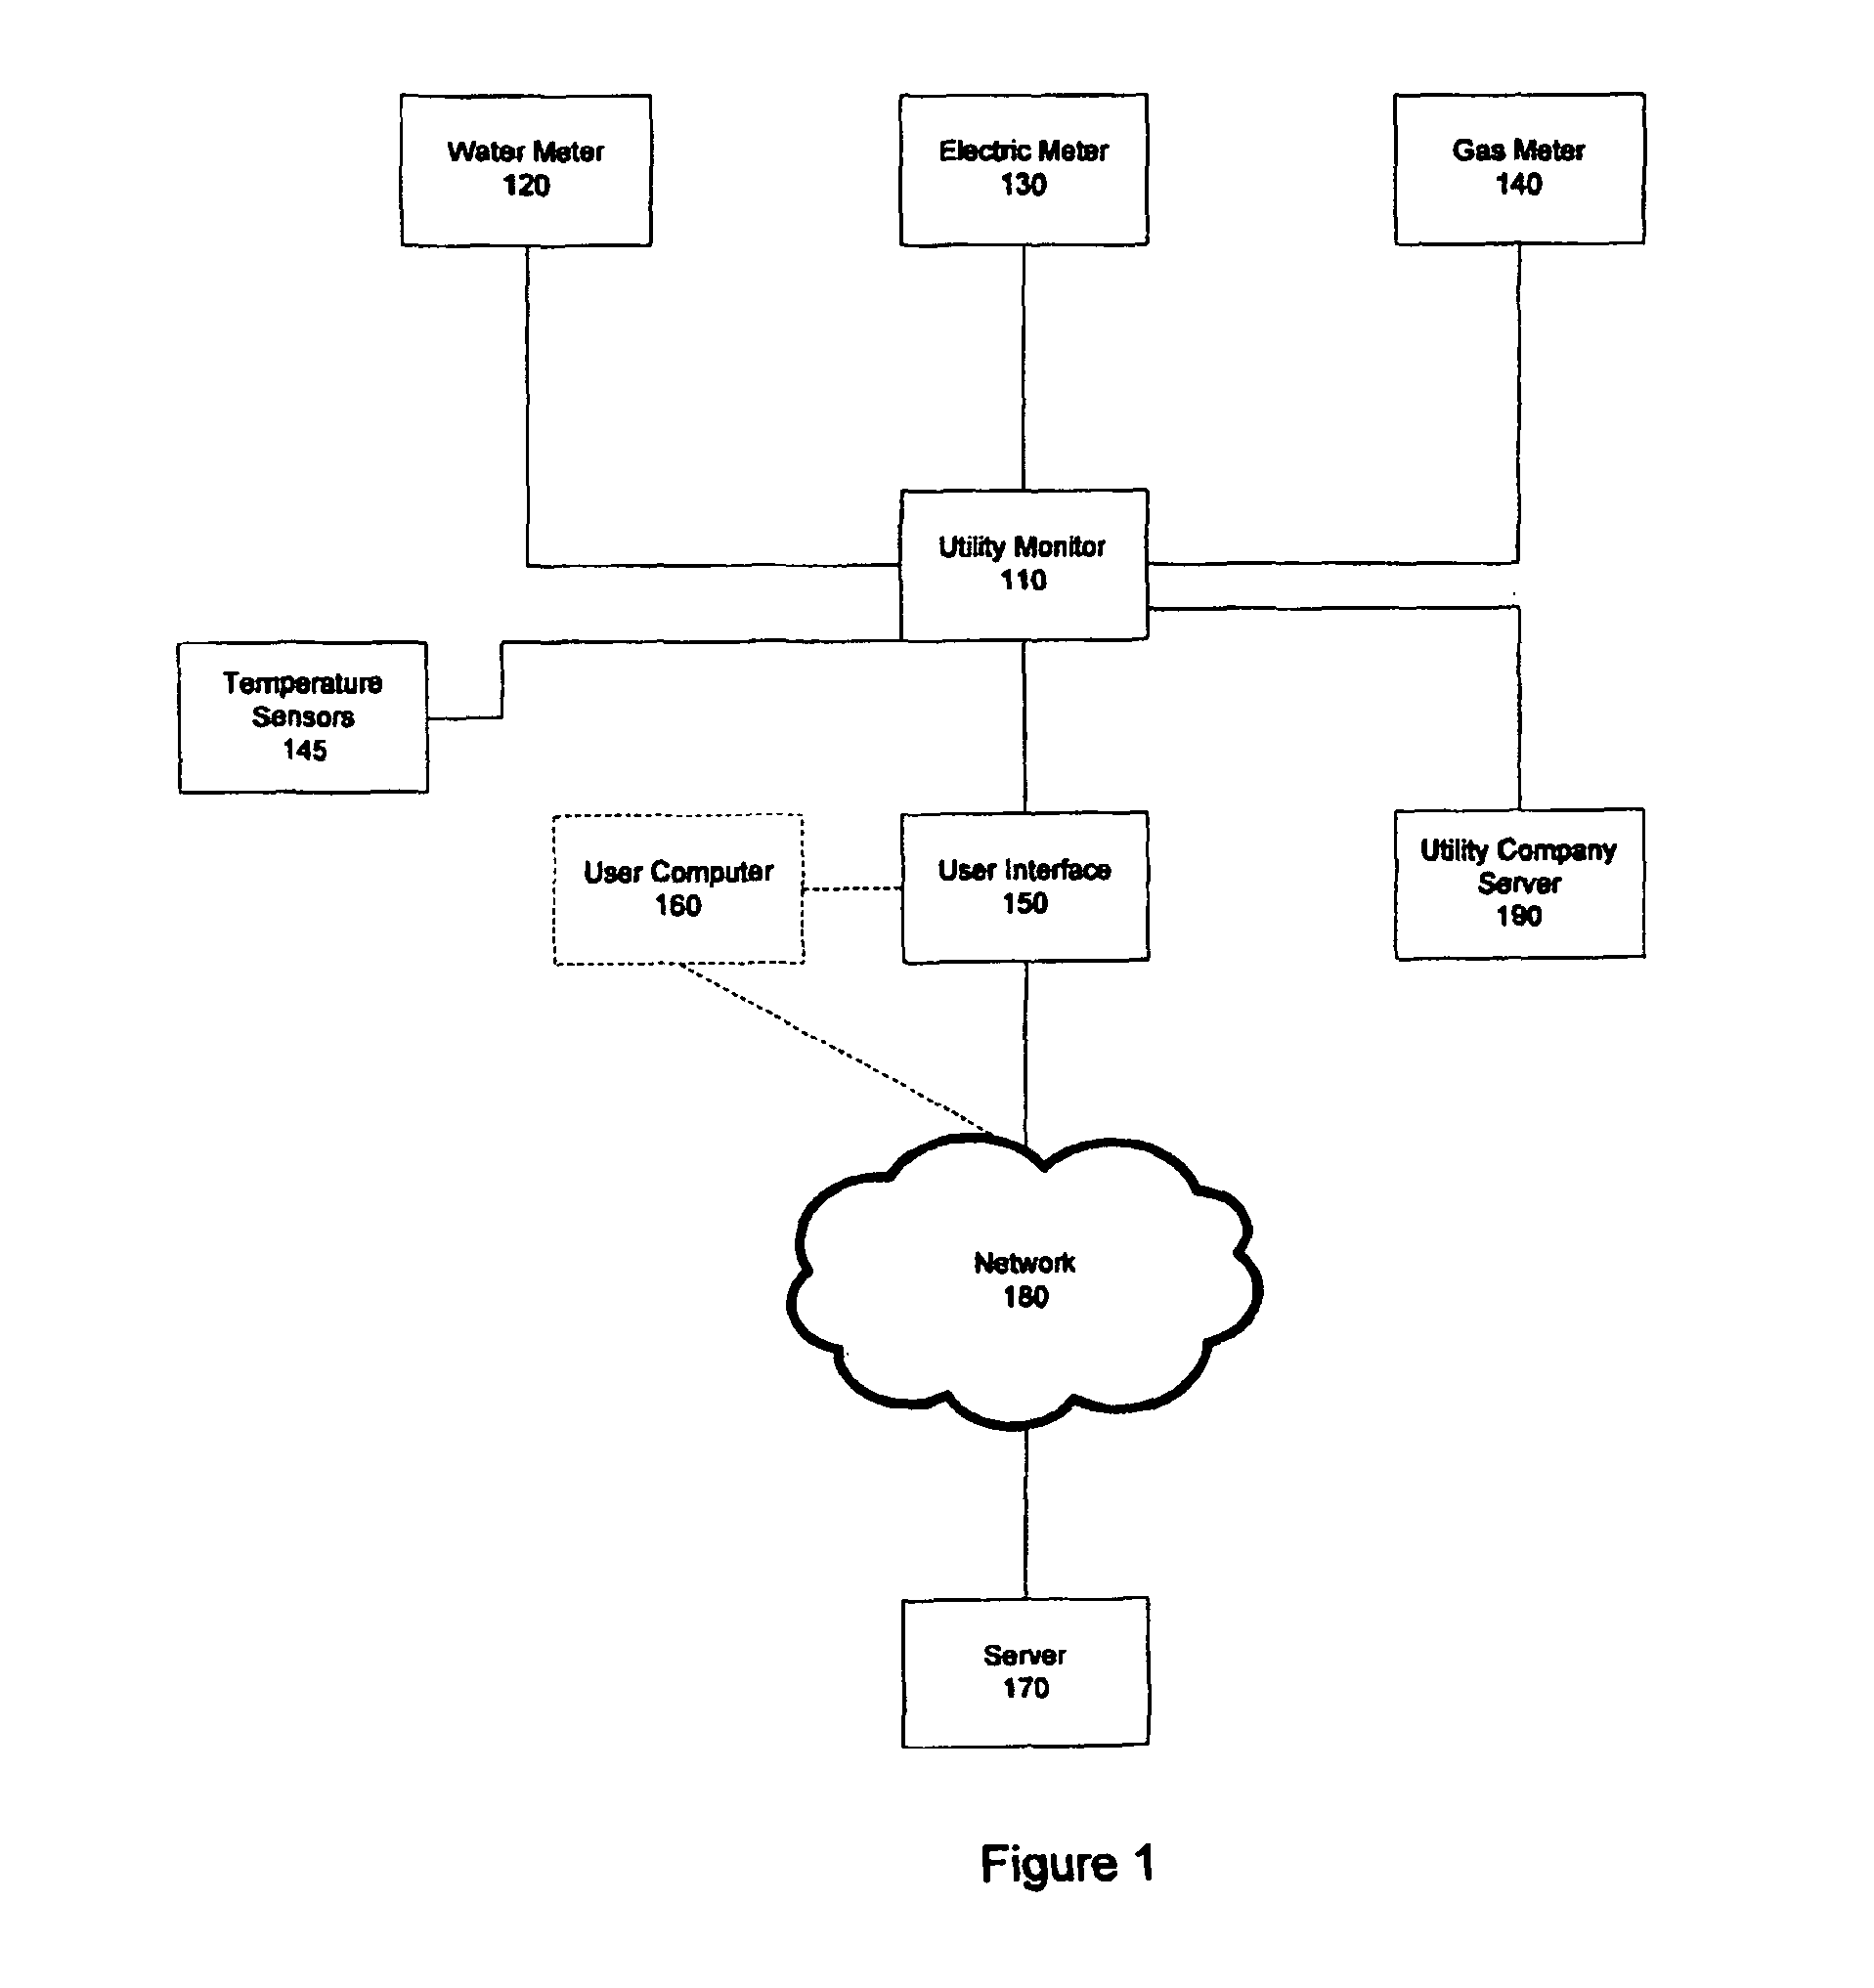
[0034]FIG. 1 illustrates, generally, a disclosed utility monitoring system 100. The utility monitoring system 100 includes a utility monitor 110 in communication with various utility meters 120, 130, 140. As used herein, “meter” refers to a device that can track consumption or use of a particular quantity. For example, an electrical meter that tracks electricity consumption can be a meter installed by a power company or another metering device, such as a supplemental electrical meter (not shown) installed in a circuit breaker panel.

[0035]The utility monitor 110 can be, or include, a multiplexer, analog to digital converter, digital signal processor, or power line...


PUM


Abstract

Embodiments for monitoring one or more utilities consumed within a monitored area including detecting an amount of a first utility consumed by a load associated with a device and an amount of a second utility consumed by a load associated with the device. The identity of the device is determined based on the amount of the first and second utility consumed. A utility monitoring method is disclosed that includes measuring an amount of a utility consumed by a first device at a first time and an amount of a utility consumed by a second device at a second time. The identity of the first device is determined based on the measured consumption of the first and second devices at the first and second time. In certain implementations, the electricity meter uses an effective variance analysis of the conductance waveform on an electrical circuit to identify specific appliances.

Description

CROSS REFERENCE TO RELATED APPLICATIONS[0001]This application claims benefit as a 371 of PCT / US06 / 48134, filed on Dec. 15, 2006, which claims the benefit of, and incorporates by reference, U.S. Provisional Patent Application No. 60 / 803,323, filed May 26, 2006.TECHNICAL FIELD[0002]The present application relates generally to utility monitors and their methods of use. In particular examples, the present application provides a non-intrusive utility monitor which can be used to monitor a plurality of discrete loads.BACKGROUND[0003]In most residences and small businesses, utility consumers learn about their utility consumption through a bill delivered once per month. This system has limited ability to promote conservation since the consumer does not have feedback to associate their specific activities to a particular cost. This lack of information can result in a disconnect between the perception of utility costs and their actual costs. The lack of timely and / or specific information can ...

Claims


Application Information

Patent Timeline
Patent Type & Authority Patents(United States)
IPC IPC(8): G06F17/00G05D3/12G01R13/00G01R27/02G01R23/16G06N5/02G05D5/00G05D17/00G05D11/00G05D9/00
CPCG06Q10/06H02J4/00G08C19/00
Inventor KUHNS, HAMPDENEDWARDS, PETER R.NIKOLICH, GEORGEROBERTS, MORIEN W.
Owner BOARD OF RGT NEVADA SYST OF HIGHER EDUCATION ON BEHALF OF THE DESERT RES INST
Why Eureka
Try Eureka