
Method for determining insulin sensitivity with biomarkers

a biomarker and insulin sensitivity technology, applied in the field of biomarkers, can solve the problems of impaired glucose utilization ability, insulin becomes less effective at helping tissues metabolize glucose, and long-term physiological damage already occurring at this stag

Active Publication Date: 2012-05-29
METABOLON
View PDF19 Cites 74 Cited by
  • Summary
  • Abstract
  • Description
  • Claims
  • Application Information

AI Technical Summary

Benefits of technology

The present patent provides methods for diagnosing and monitoring insulin resistance, glucose tolerance, and metabolic syndrome in a subject. These methods involve analyzing biomarkers in a biological sample from the subject and comparing them to reference levels to diagnose or predict the subject's condition. The biomarkers include proteins, lipids, and other molecules that are associated with insulin resistance, glucose disposal, obesity, and cardiovascular disease. The methods can be used for research and clinical applications, and can help in identifying and monitoring the progression or regression of pre-diabetes and metabolic syndrome.

Problems solved by technology

Type 2 diabetes develops over 10 to 20 years and results from an impaired ability to utilize glucose (glucose utilization) due to impaired sensitivity to insulin (insulin resistance).
In pre-diabetes, insulin becomes less effective at helping tissues metabolize glucose.
Studies have shown that although patients show very few symptoms, long-term physiological damage is already occurring at this stage.
Further, these methods suffer from variability and methodological differences between laboratories and do not correlate rigorously with glucose clamp studies.
Patients diagnosed with Metabolic Syndrome are at an increased risk of developing diabetes, cardiac and vascular disease.
While it can affect anyone at any age, the incidence increases with increasing age and in individuals who are inactive, and significantly overweight, especially with excess abdominal fat.
There are no well-accepted criteria for diagnosing the metabolic syndrome.
Mirroring the obesity epidemic, pre-diabetes and diabetes are largely preventable but are frequently undiagnosed or diagnosed too late due to the asymptomatic nature of the progression to clinical disease.

Method used


Image

  • Method for determining insulin sensitivity with biomarkers
  • Method for determining insulin sensitivity with biomarkers
  • Method for determining insulin sensitivity with biomarkers

Examples


examples

I. General Methods

[0151]A. Identification of Metabolic Profiles

[0152]Each sample was analyzed to determine the concentration of several hundred metabolites. Analytical techniques such as GC-MS (gas chromatography-mass spectrometry) and LC-MS (liquid chromatography-mass spectrometry) were used to analyze the metabolites. Multiple aliquots were simultaneously, and in parallel, analyzed, and, after appropriate quality control (QC), the information derived from each analysis was recombined. Every sample was characterized according to several thousand characteristics, which ultimately amount to several hundred chemical species. The techniques used were able to identify novel and chemically unnamed compounds.

[0153]B. Statistical Analysis

[0154]The data was analyzed using several statistical methods to identify molecules (either known, named metabolites or unnamed metabolites) present at differential levels in a definable population or subpopulation (e.g., biomarkers for metabolic syndrome ...

example 2

Biomarkers of Pre-Diabetes

2A: Identification of Biomarkers that Correlate with Glucose Disposal

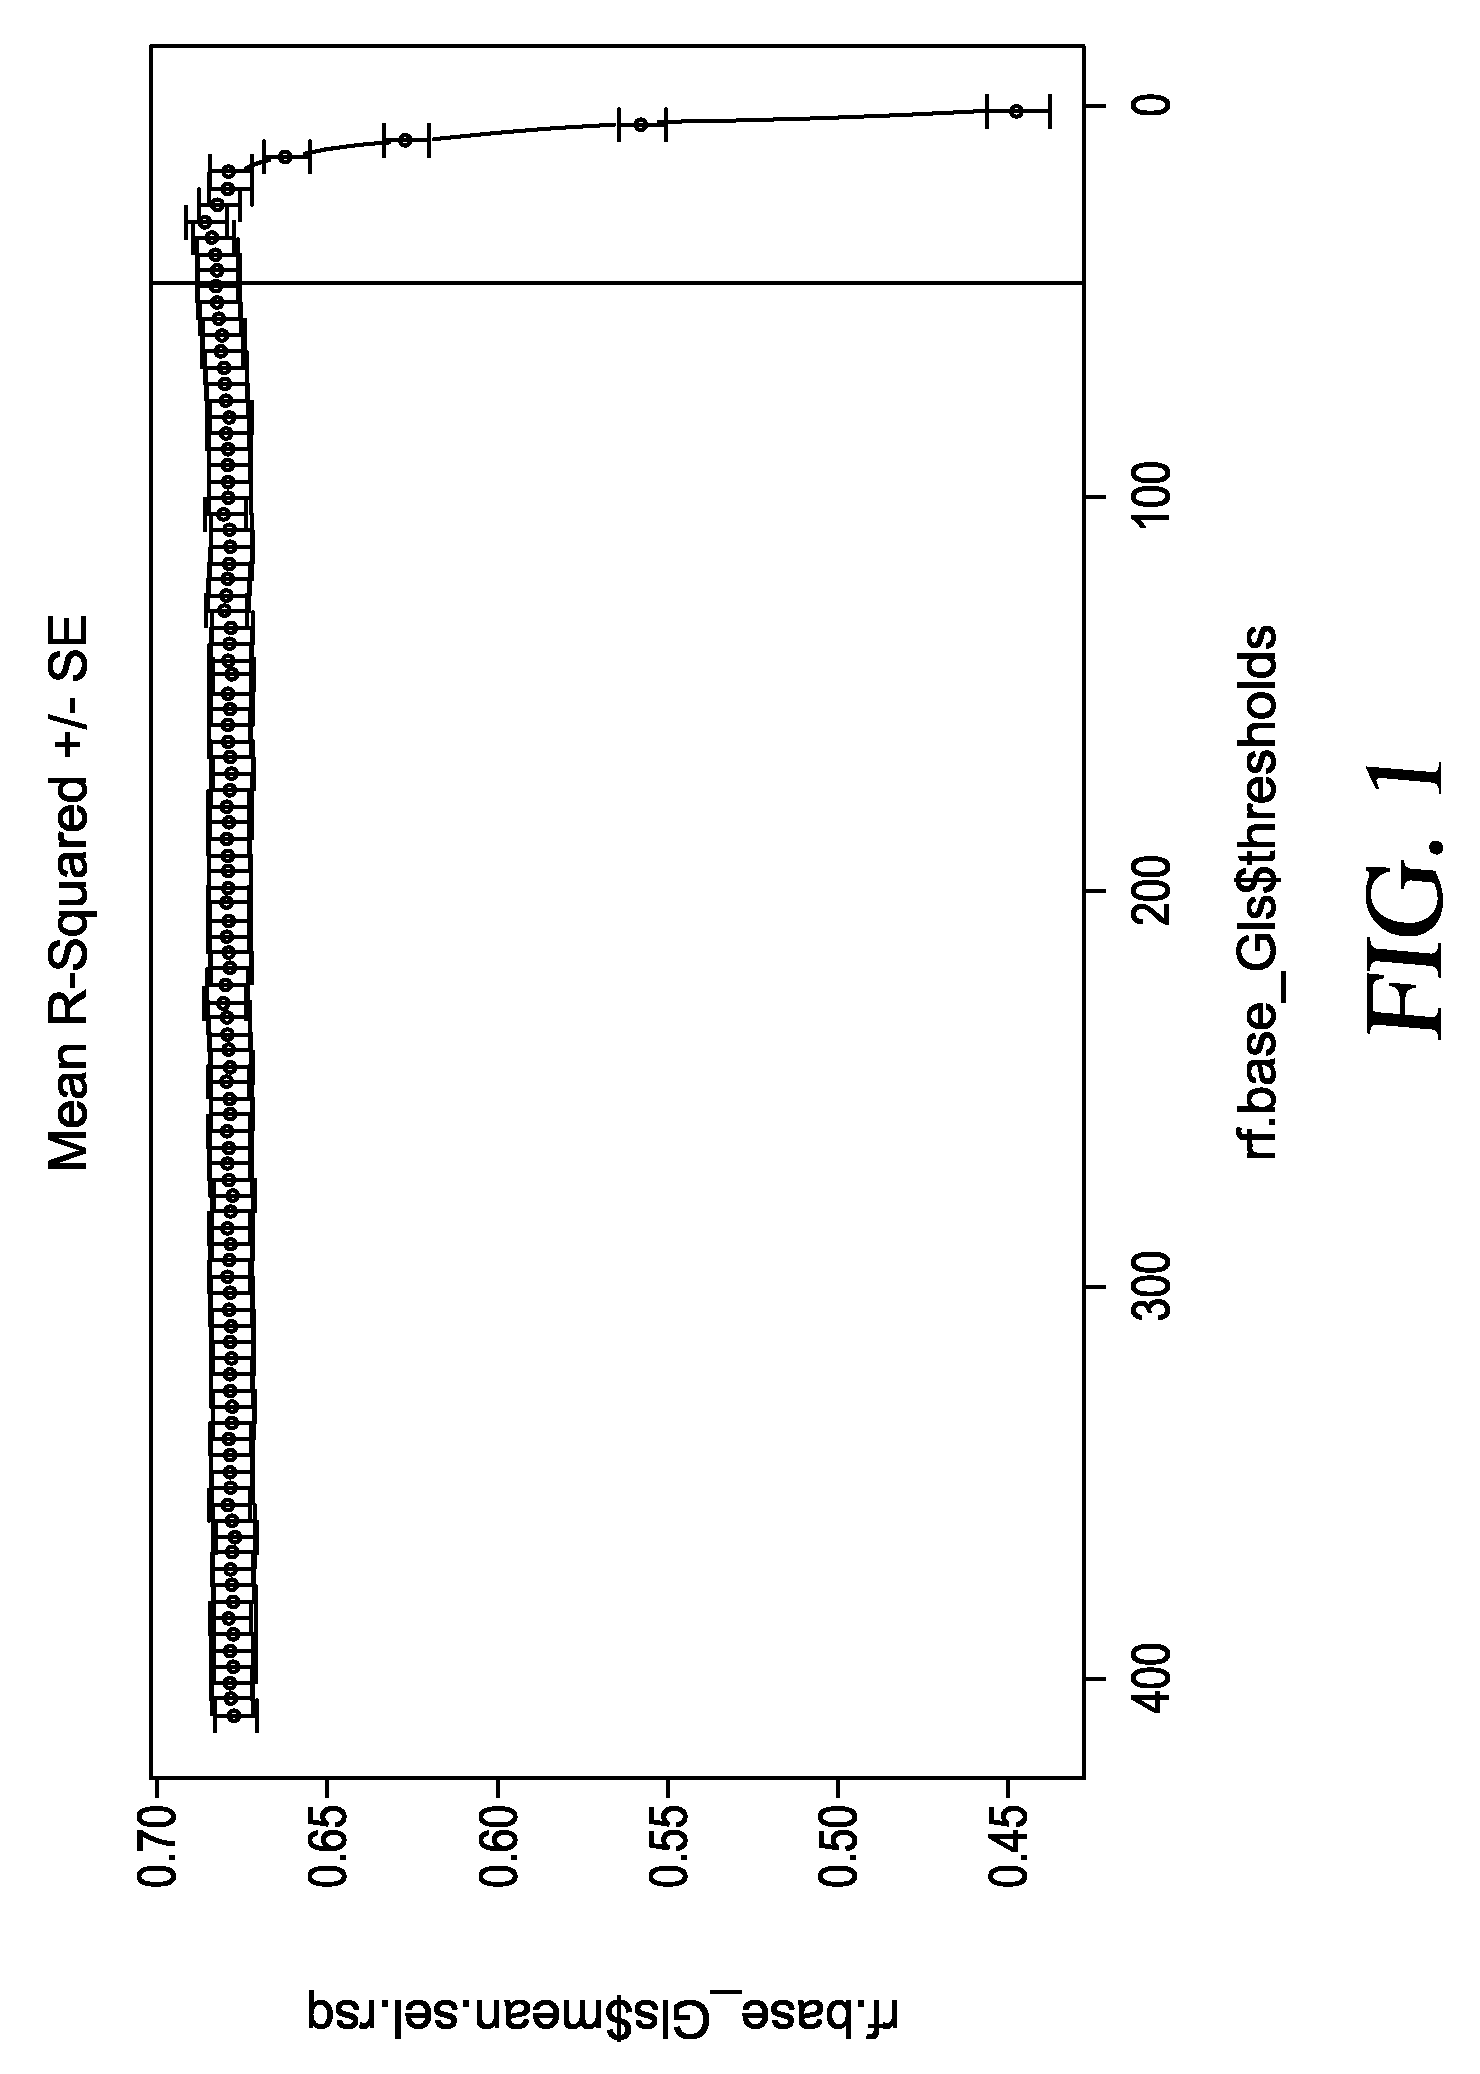
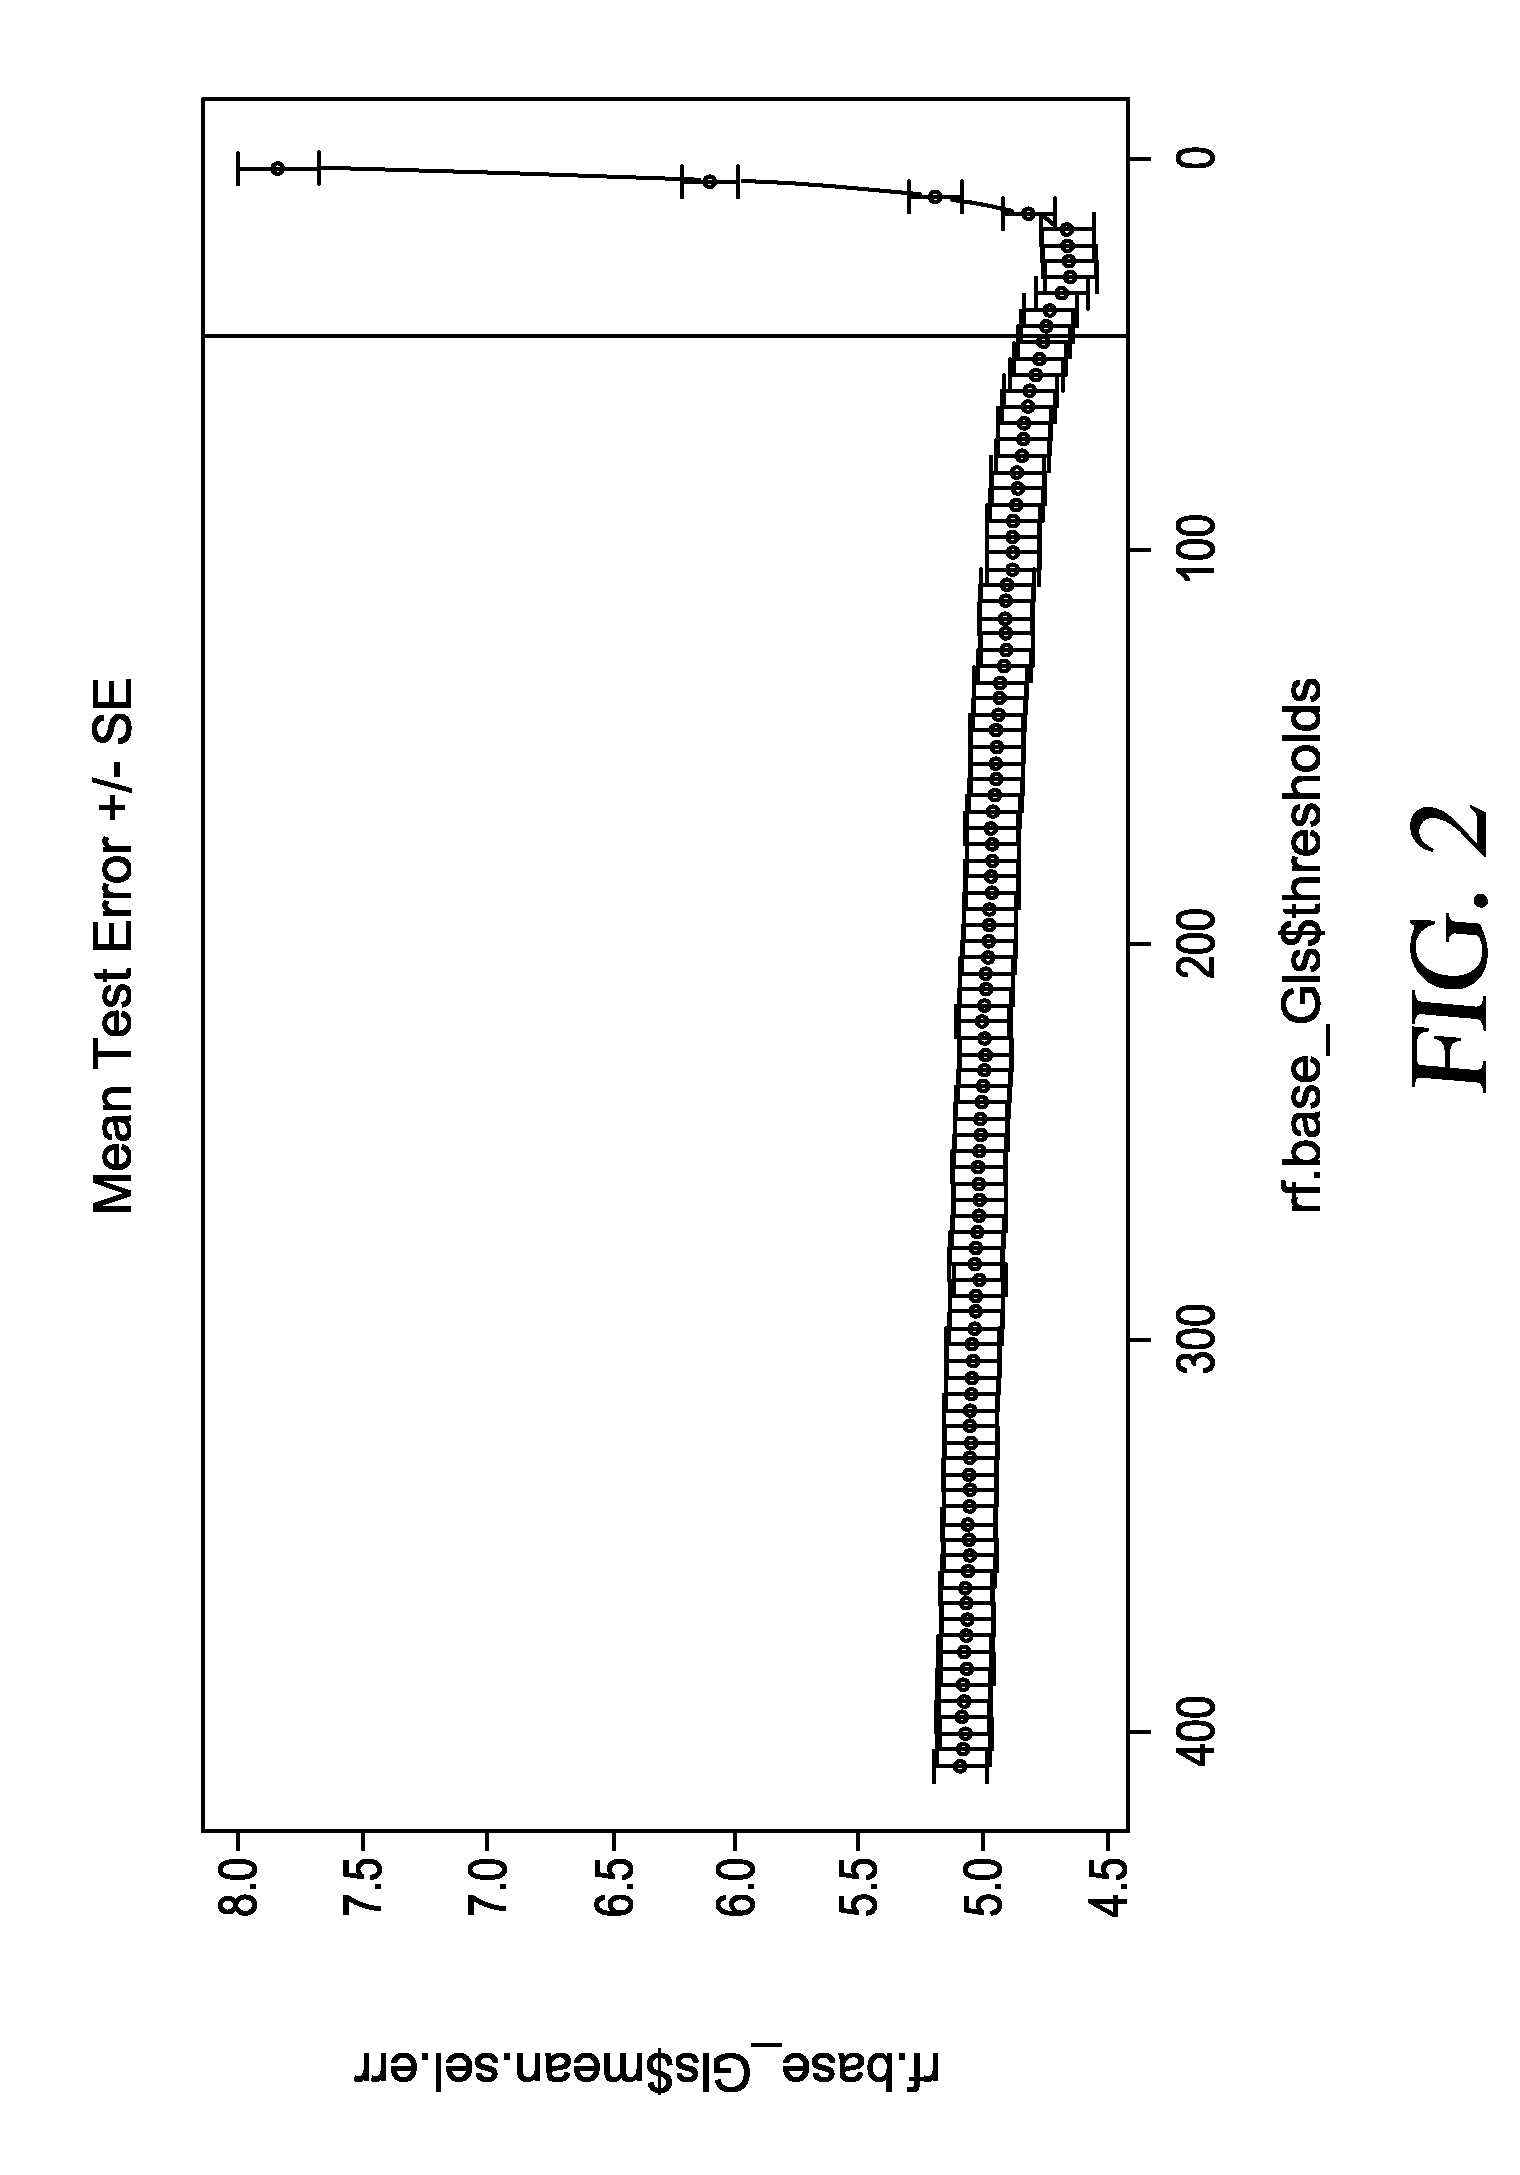
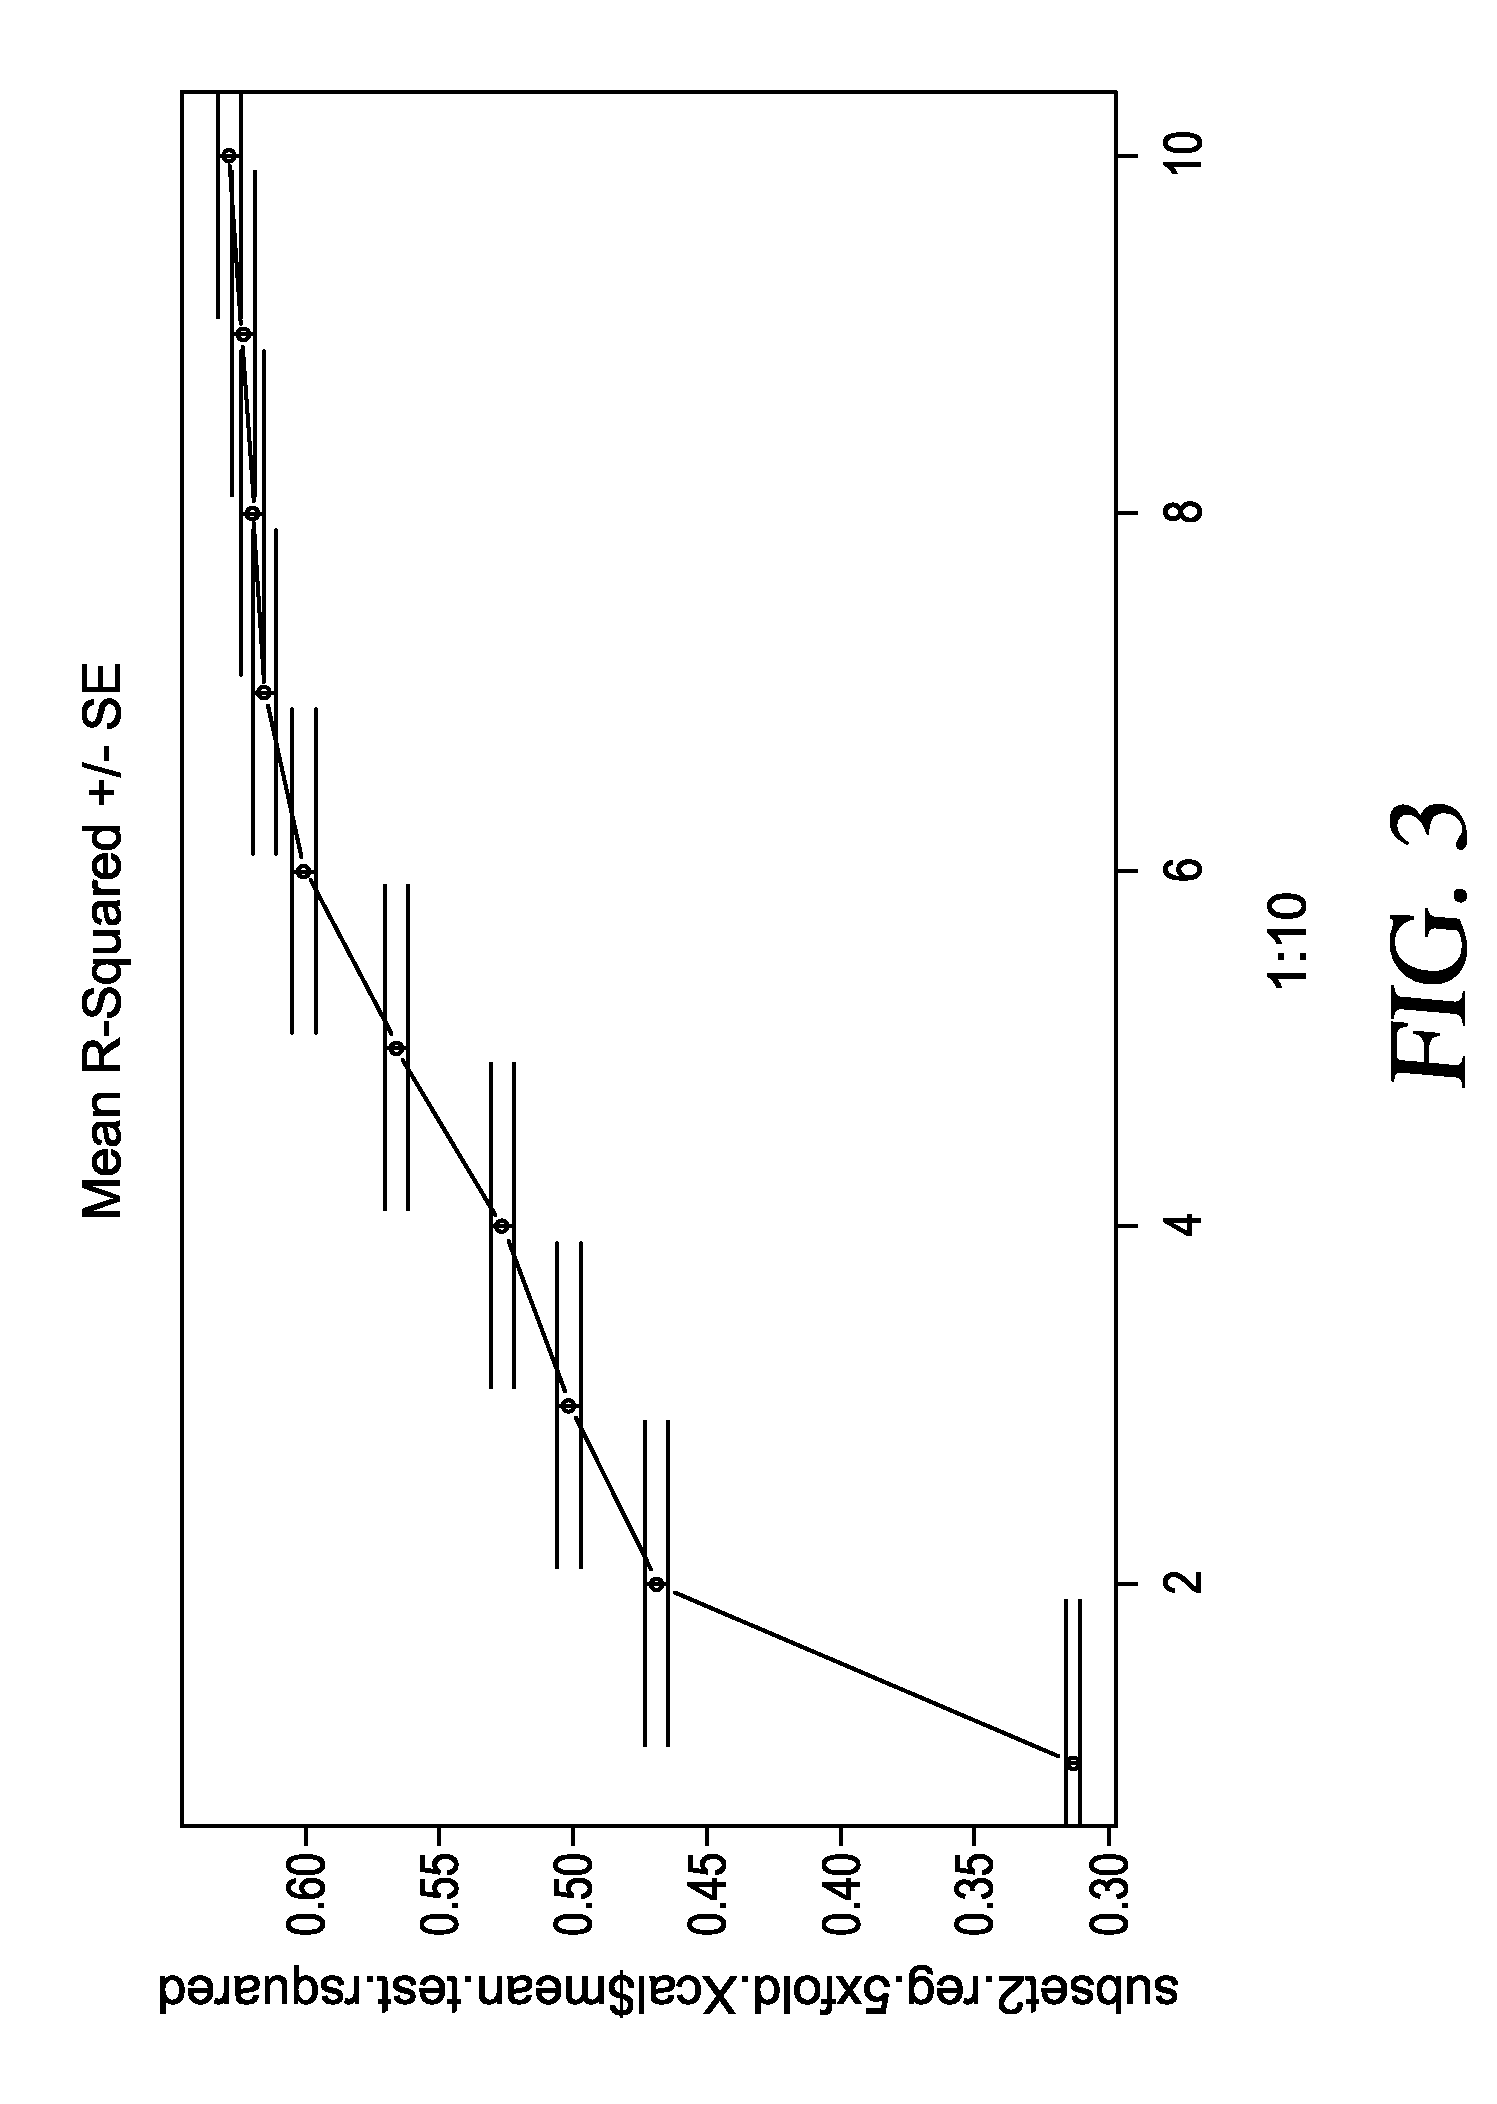
[0159]A combination of biomarkers were discovered that, when used in an algorithm, correlate with the glucose disposal rate (i.e. Rd). Further, the initial panel of biomarkers can be narrowed for the development of targeted assays comprised of 15-30 candidate metabolites. An algorithm to predict insulin resistance was developed.

[0160]Several studies were conducted to identify biomarkers that correlate with glucose disposal. In a first study, plasma samples were collected from 113 lean, obese or diabetic subjects that had received treatment with one of three different thiazolidinedione drugs (T=troglitazone, R=rosiglitazone, or P=pioglitazone) (Table 1). Base line samples obtained from the subjects prior to treatment (S=baseline) served as controls. One to three plasma samples were obtained from each subject, with samples collected at baseline (all subjects; A), and after 12 weeks (B) or 4 ...

example 3

Biomarkers for Metabolic Syndrome Related Disorders

3A: Biomarkers of Metabolic Syndrome

[0198]Biomarkers were discovered by (1) analyzing plasma and serum samples drawn from different groups of subjects to determine the levels of metabolites in the samples and then (2) statistically analyzing the results to determine those metabolites that were differentially present in the two groups.

[0199]The samples used for the analysis were obtained from 19 Caucasian males aged 18-39, average age of 25.6, that had been diagnosed with metabolic syndrome and 19 healthy, age-matched, Caucasian males.

[0200]T-tests were used to determine differences in the mean levels of metabolites between the two populations (i.e., Metabolic syndrome vs. Healthy controls).

Biomarkers:

[0201]As listed below in Tables 12 and 13, biomarkers were discovered that were differentially present between samples from subjects with Metabolic Syndrome and Control (healthy) subjects.

[0202]Tables 12 and 13 include, for each listed ...


PUM

PropertyMeasurementUnit
insulin resistanceaaaaaaaaaa
body weightaaaaaaaaaa
body mass indexaaaaaaaaaa

Abstract

Biomarkers relating to insulin resistance, pre-diabetes, type-2 diabetes, metabolic syndrome, atherosclerosis, and cardiomyopathy are provided, as well as methods for using such biomarkers as biomarkers for insulin resistance, pre-diabetes, type-2 diabetes, metabolic syndrome, atherosclerosis, and cardiomyopathy. In addition, methods for modulating the respective disorders or conditions of a subject are also provided. Also provided are suites of small molecule entities as biomarkers for insulin resistance, pre-diabetes, type-2 diabetes, metabolic syndrome, atherosclerosis, and cardiomyopathy.

Description

CROSS-REFERENCE TO RELATED APPLICATIONS[0001]This application claims the benefit of U.S. Provisional Application No. 60 / 950,286, filed Jul. 17, 2007, and U.S. Provisional Application No. 61 / 037,628, filed Mar. 18, 2008, the entireties of which are hereby incorporated by reference herein.FIELD[0002]The invention generally relates to biomarkers, methods for identifying biomarkers correlated to insulin resistance, cardiovascular disease, and metabolic-syndrome-related disorders and methods based on the same biomarkers.BACKGROUND[0003]Diabetes is classified as either type 1 (early onset) or type 2 (adult onset), with type 2 comprising 90-95% of the cases of diabetes. Diabetes is the final stage in a disease process that begins to affect individuals long before the diagnosis of diabetes is made. Type 2 diabetes develops over 10 to 20 years and results from an impaired ability to utilize glucose (glucose utilization) due to impaired sensitivity to insulin (insulin resistance).[0004]In pre...

Claims


Application Information

Patent Timeline
Patent Type & Authority Patents(United States)
IPC IPC(8): C12Q1/54
CPCG01N33/6893G01N33/487G01N33/5091G01N33/483G01N2800/32G01N2800/044G01N2800/52G01N2800/04G01N2800/50G01N2800/042G01N2800/56A61P3/04A61P9/10A61P3/10G01N33/5308
Inventor HU, YUN FUCHIRILA, COSTELALEXANDER, DANNYMILBURN, MICHAELMITCHELL, MATTHEW W.GALL, WALTERLAWTON, KAY A.
Owner METABOLON
Learn More