System and method for displaying key performance indicators in an application design tool

a technology of performance indicators and application design tools, applied in the field of software design tools, can solve the problems of not having a set of tools that completely link the application reporting system to the design tools, and the current application reporting tools do not actively provide key performance indicators (kpis) back to the software design

Active Publication Date: 2014-06-24
NUANCE COMM INC
View PDF78 Cites 4 Cited by
  • Summary
  • Abstract
  • Description
  • Claims
  • Application Information

AI Technical Summary

Benefits of technology

[0005]The present invention provides a system and method that closes the loop in the full application lifecycle by providing key performance indicators for an executed application back to the design phase. Specifically, the present invention enables an application designer / developer to design an application using a design tool, deploy the application for execution, and subsequently view statistics related to the execution within the design tool.
[0009]In one embodiment, the designer can elect to see performance statistics only for nodes that satisfy certain performance thresholds (e.g., “show nodes that resulted in a problem during at least 30% of the executions of such node”). In response to a designer entering threshold requirements, the design tool identifies nodes that satisfy such thresholds (based on the statistics) and displays statistical information in the UI for only such nodes. This enables designers to easily find nodes that could be improved through the design or other application specification modifications.

Problems solved by technology

Although this lifecycle is considered a closed loop when there is an optimization recommendation that feeds back to the design process, there is not a set of tools that completely links the application reporting systems to the design tools.
Specifically, current application reporting tools do not actively provide key performance indicators (KPIs) back to the software design tool.

Method used


Image

  • System and method for displaying key performance indicators in an application design tool
  • System and method for displaying key performance indicators in an application design tool
  • System and method for displaying key performance indicators in an application design tool

Examples


Embodiment Construction

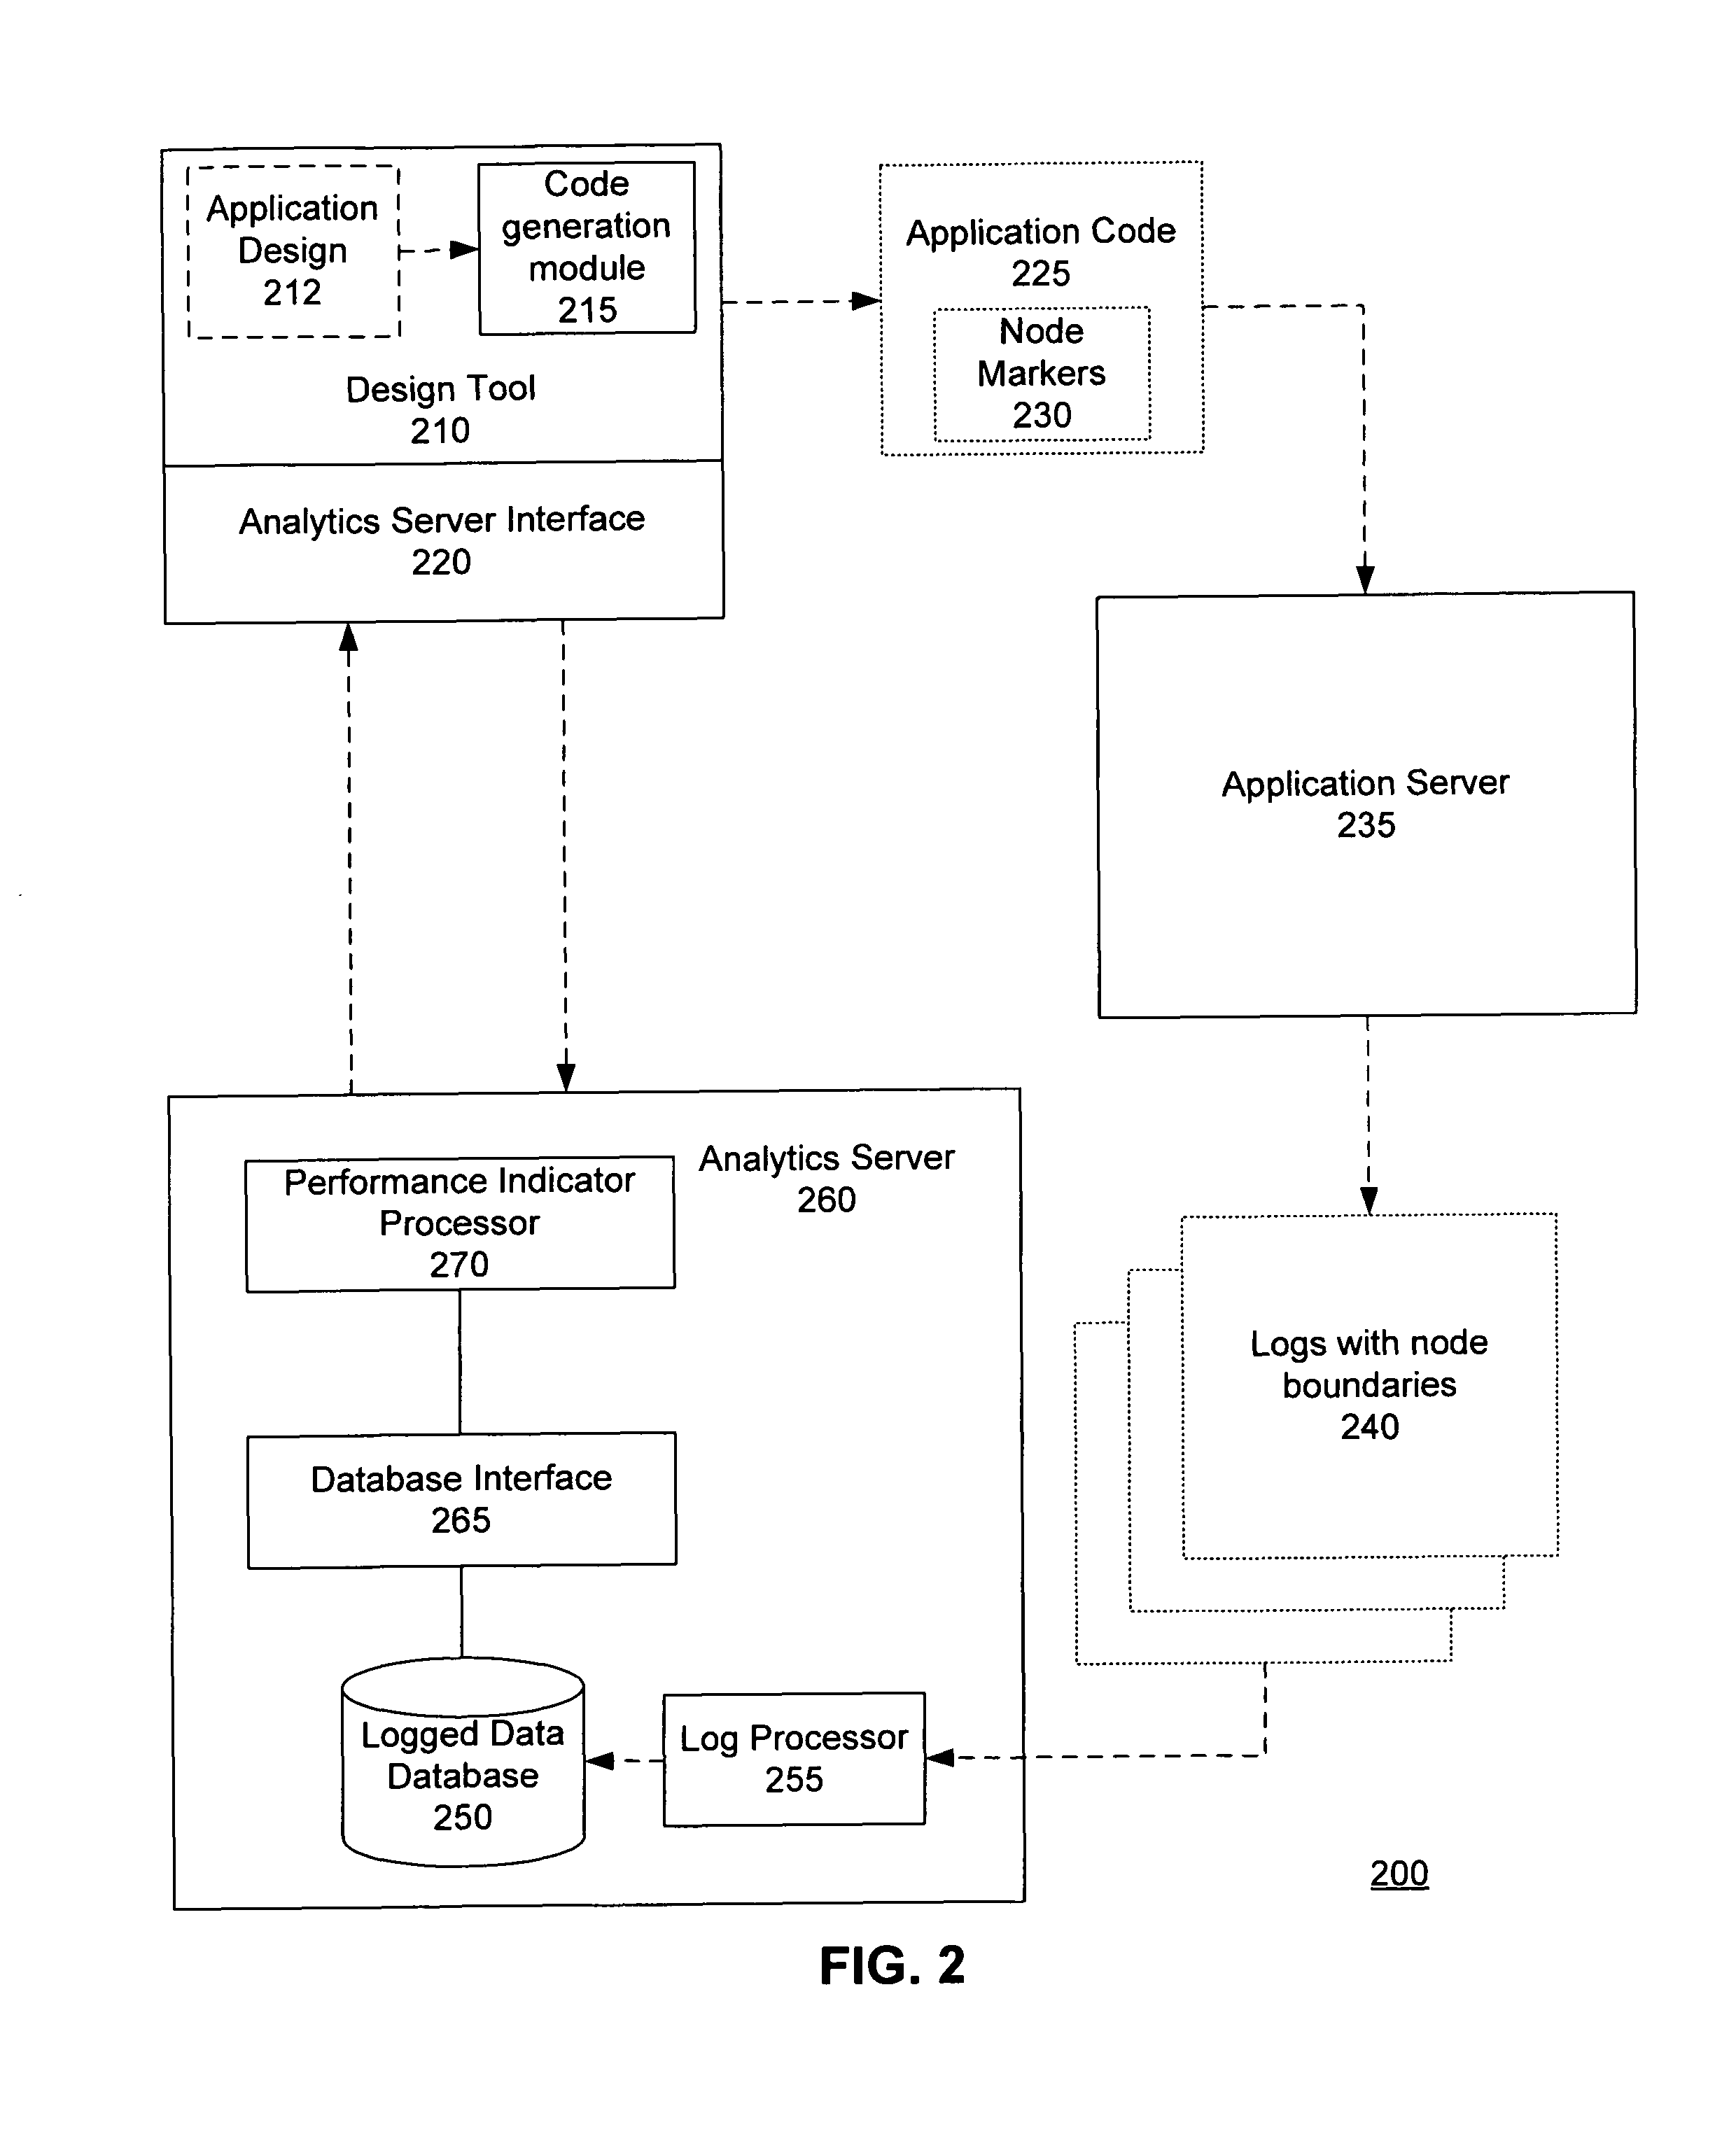
[0015]FIG. 2 illustrates an example system in which the present invention may be implemented. FIG. 2 is only an example and those skilled in the art will appreciate that the methods described with respect to FIGS. 3-5 can be implemented by other types of systems.

[0016]The system 200 includes a Design Tool 210 that provides an interface via which a user can graphically design an application, such as an IVR application, a web application, a mobile phone application, or a multi-modal communication application. The Design Tool runs on either a server or a stand-alone computer. The Design Tool 210 includes a Code Generation Module 215 that generates application code 225 based on the application design 212. As will be discussed in more detail with respect to FIG. 3, the application code includes node markers 230.

[0017]The application code is deployed and executed on an Application Server 235, which represents one server or a network of servers. In executing the application code 225, the A...


PUM


Abstract

A system and method enable a designer to design an application using a design tool, deploy the application for execution, and subsequently view statistics related to the execution within the design tool. The designer uses the design tool to create an application flow for the application, and the design tool then generates software code for such application. In generating software code, the design tool inserts markers in the application code that demarks the boundaries between nodes in the application flow. When the application is executed, a log is created in accordance with the markers such that data is logged for nodes traversed during the execution of the application. Using the logged data, statistics are calculated for one or more of the nodes. These statistics are provided to the design tool and, in the preferred embodiment, displayed in conjunction with the application flow in the user interface of the design tool.

Description

BACKGROUND OF THE INVENTION[0001]1. Field of the Invention[0002]This invention relates generally to software design tools and, more particularly to displaying key performance indicators for an executed application in a user interface of an application design tool.[0003]2. Description of the Background Art[0004]As shown in FIG. 1, the lifecycle of an application, especially those that engage in a dialog with a user (e.g., an interactive voice response (IVR) application) often includes phases in design, development, deployment (i.e., execution), and optimization, where optimization is based on performance data generated by application reporting systems. Although this lifecycle is considered a closed loop when there is an optimization recommendation that feeds back to the design process, there is not a set of tools that completely links the application reporting systems to the design tools. Specifically, current application reporting tools do not actively provide key performance indica...

Claims


Application Information

Patent Timeline
Patent Type & Authority Patents(United States)
IPC IPC(8): G06F3/0484G06F9/445G06F9/44
CPCG06F8/20H04L45/02G06F9/44G06F9/445G06F8/34G06F3/04842
Inventor ULUG, AMY E.PANGANAMALA, SURESH K.SPRINGER, STEPHEN R.RAMADAS, RAKESHSMITH, JR., WILLIAM BRIDGESRAMAN, VIJAY R.PATHAK, DEEPALI
Owner NUANCE COMM INC
Why Eureka
Try Eureka