
Analysis and prediction of data using clusterization

Inactive Publication Date: 2015-01-13
C4CAST COM
View PDF4 Cites 242 Cited by
  • Summary
  • Abstract
  • Description
  • Claims
  • Application Information

AI Technical Summary

Benefits of technology

The invention provides contests that have features that help improve the rankings of participants and create a better database of predictions. Additionally, the invention groups together website advertisements based on the products or services they advertise. This helps to create a continuous and consistent system of advertisements, while also learning from changing advertisements. For example, the invention can predict new housing starts based on click-through rates from mortgage advertisements.

Problems solved by technology

However, the present inventors have discovered that such conventional contests are inadequate in the following respects.
First, the rankings generated by such contests typically do not provide useful information for truly identifying the best forecasters.
In addition, these conventional contests often reward short-term or single-event thinking, and such qualities may not be the most desirable in many cases.
In the financial and economic arenas, the result is that traditionally there has been insufficient data upon which investors could rely in order to select investment advisors.
At the same time, many actual and potential investment advisors who are very capable at reading the market conventionally have had very little opportunity to demonstrate their expertise to the public, and thereby attract new clients.
While such prediction submission techniques are adequate for their intended purpose, they suffer from many shortcomings.
First, such conventional prediction submission techniques frequently are not very intuitive from the participant's point of view.
This is a significant disadvantage for those participants who are very intuitive oriented.
Moreover, to the extent such persons are prone to errors in processing such data when converting their rough perceptions into a hard number, their submitted predictions may vary from what they actually believe about the subject variable.
Second, having to enter numerical estimates for each prediction variable can be cumbersome and time-consuming.
This may have the effect of limiting the number of variables for which participants are willing to submit predictions.
While other prediction submission techniques have been utilized, they typically have had very limited applicability.
As can be readily appreciated, this technique generally is limited to predicting binary events (i.e., will / will-not occur).
In many cases, this deficiency will limit the applicability of such techniques to collection of very coarse predictions.
As a result, the amount of information available on the Internet can be staggering.
However, there is often little done to insure that the information provided to end users is the most relevant to those users.
No individual knows all the market conditions in advance of trying to buy or sell.
Such large multiple equation mathematical forecasting models of the economy are ever increasingly complex, modeling ever-finer levels of economic detail, but their very complexity often makes them inaccurate as forecasting tools.
However, to the extent that the starting values are not precisely measured, or that there are even ever-so-slight errors in the mathematical equations, the resulting forecasts can display extraordinary deviation from the values that eventually are observed in the economy.
These problems are made worse if, for any reason, historical economic data were generated by a different set of relationships than are now found in the economy.
However, these forecasting techniques are viewed with some suspicion by many economists and forecasters because they lead to models developed using empirical criteria, not models specified as the logical result of economic theory.
Although neural networks are the foundation of numerous automated trading and arbitrage systems on Wall Street, in practice they sometimes “learn” too slowly and converge on very localized forecasting rules, which do not generalize well.
However, these techniques are in their infancy and because of sparse historical data may never be of more than limited use in most economic forecasting applications.
Although the consensus forecast median is a combination forecast, median forecasts usually are not the best combination forecasts, given the available data.
Because virtually all computation was still done on cumbersome mainframe systems, often as overnight batch computation jobs, forecasts were expensive to obtain.
Even if a large number of forecasts were available, the optimal combinations could have required more computing power than was readily available to users, just as the Markowitz portfolio problems were generally intractable in practice.
Hence, demand grew for consensus forecasts based on simple surveys of forecasters, but more advanced combinations were not widely used due to cost, data constraints, and computational complexity.
In addition, combination forecasting can be difficult to implement for a large forecasting panel over a significant period of time, largely because the makeup of the forecasting panel varies over time and because the frequency of participation by the various members of the forecasting panel cannot be adequately controlled.
Still further, in certain cases there may be insufficient forecaster participation to permit a combination forecast of sufficient accuracy.
Also, even if an accurate combination forecast is generated for a variable, it may be difficult to say with any certainty what was the relative importance of various factors arriving at the forecast.

Method used


Image

  • Analysis and prediction of data using clusterization
  • Analysis and prediction of data using clusterization
  • Analysis and prediction of data using clusterization

Examples


Embodiment Construction

[0098]In the preferred embodiment of the present invention, participants from the general population register for and then compete in a forecasting contest. Preferably, the contest is conducted over an electronic network, such as the Internet, which provides immediate access to the general population. It is also preferable that the contest is structured not as a single contest, but rather as a collection of different competitions (or challenges) in which participants may elect to participate. As discussed in more detail below, these challenges may be either mutually exclusive or may overlap to some extent. Generally speaking, in the preferred embodiment of the invention participants are ranked and / or rewarded based on their track records over a period of time in each of the different challenges in which they participate, as well as on how well they do in predicting values for certain individual variables (e.g., individual stock or commodity prices) and how well they do in different ...


PUM


Abstract

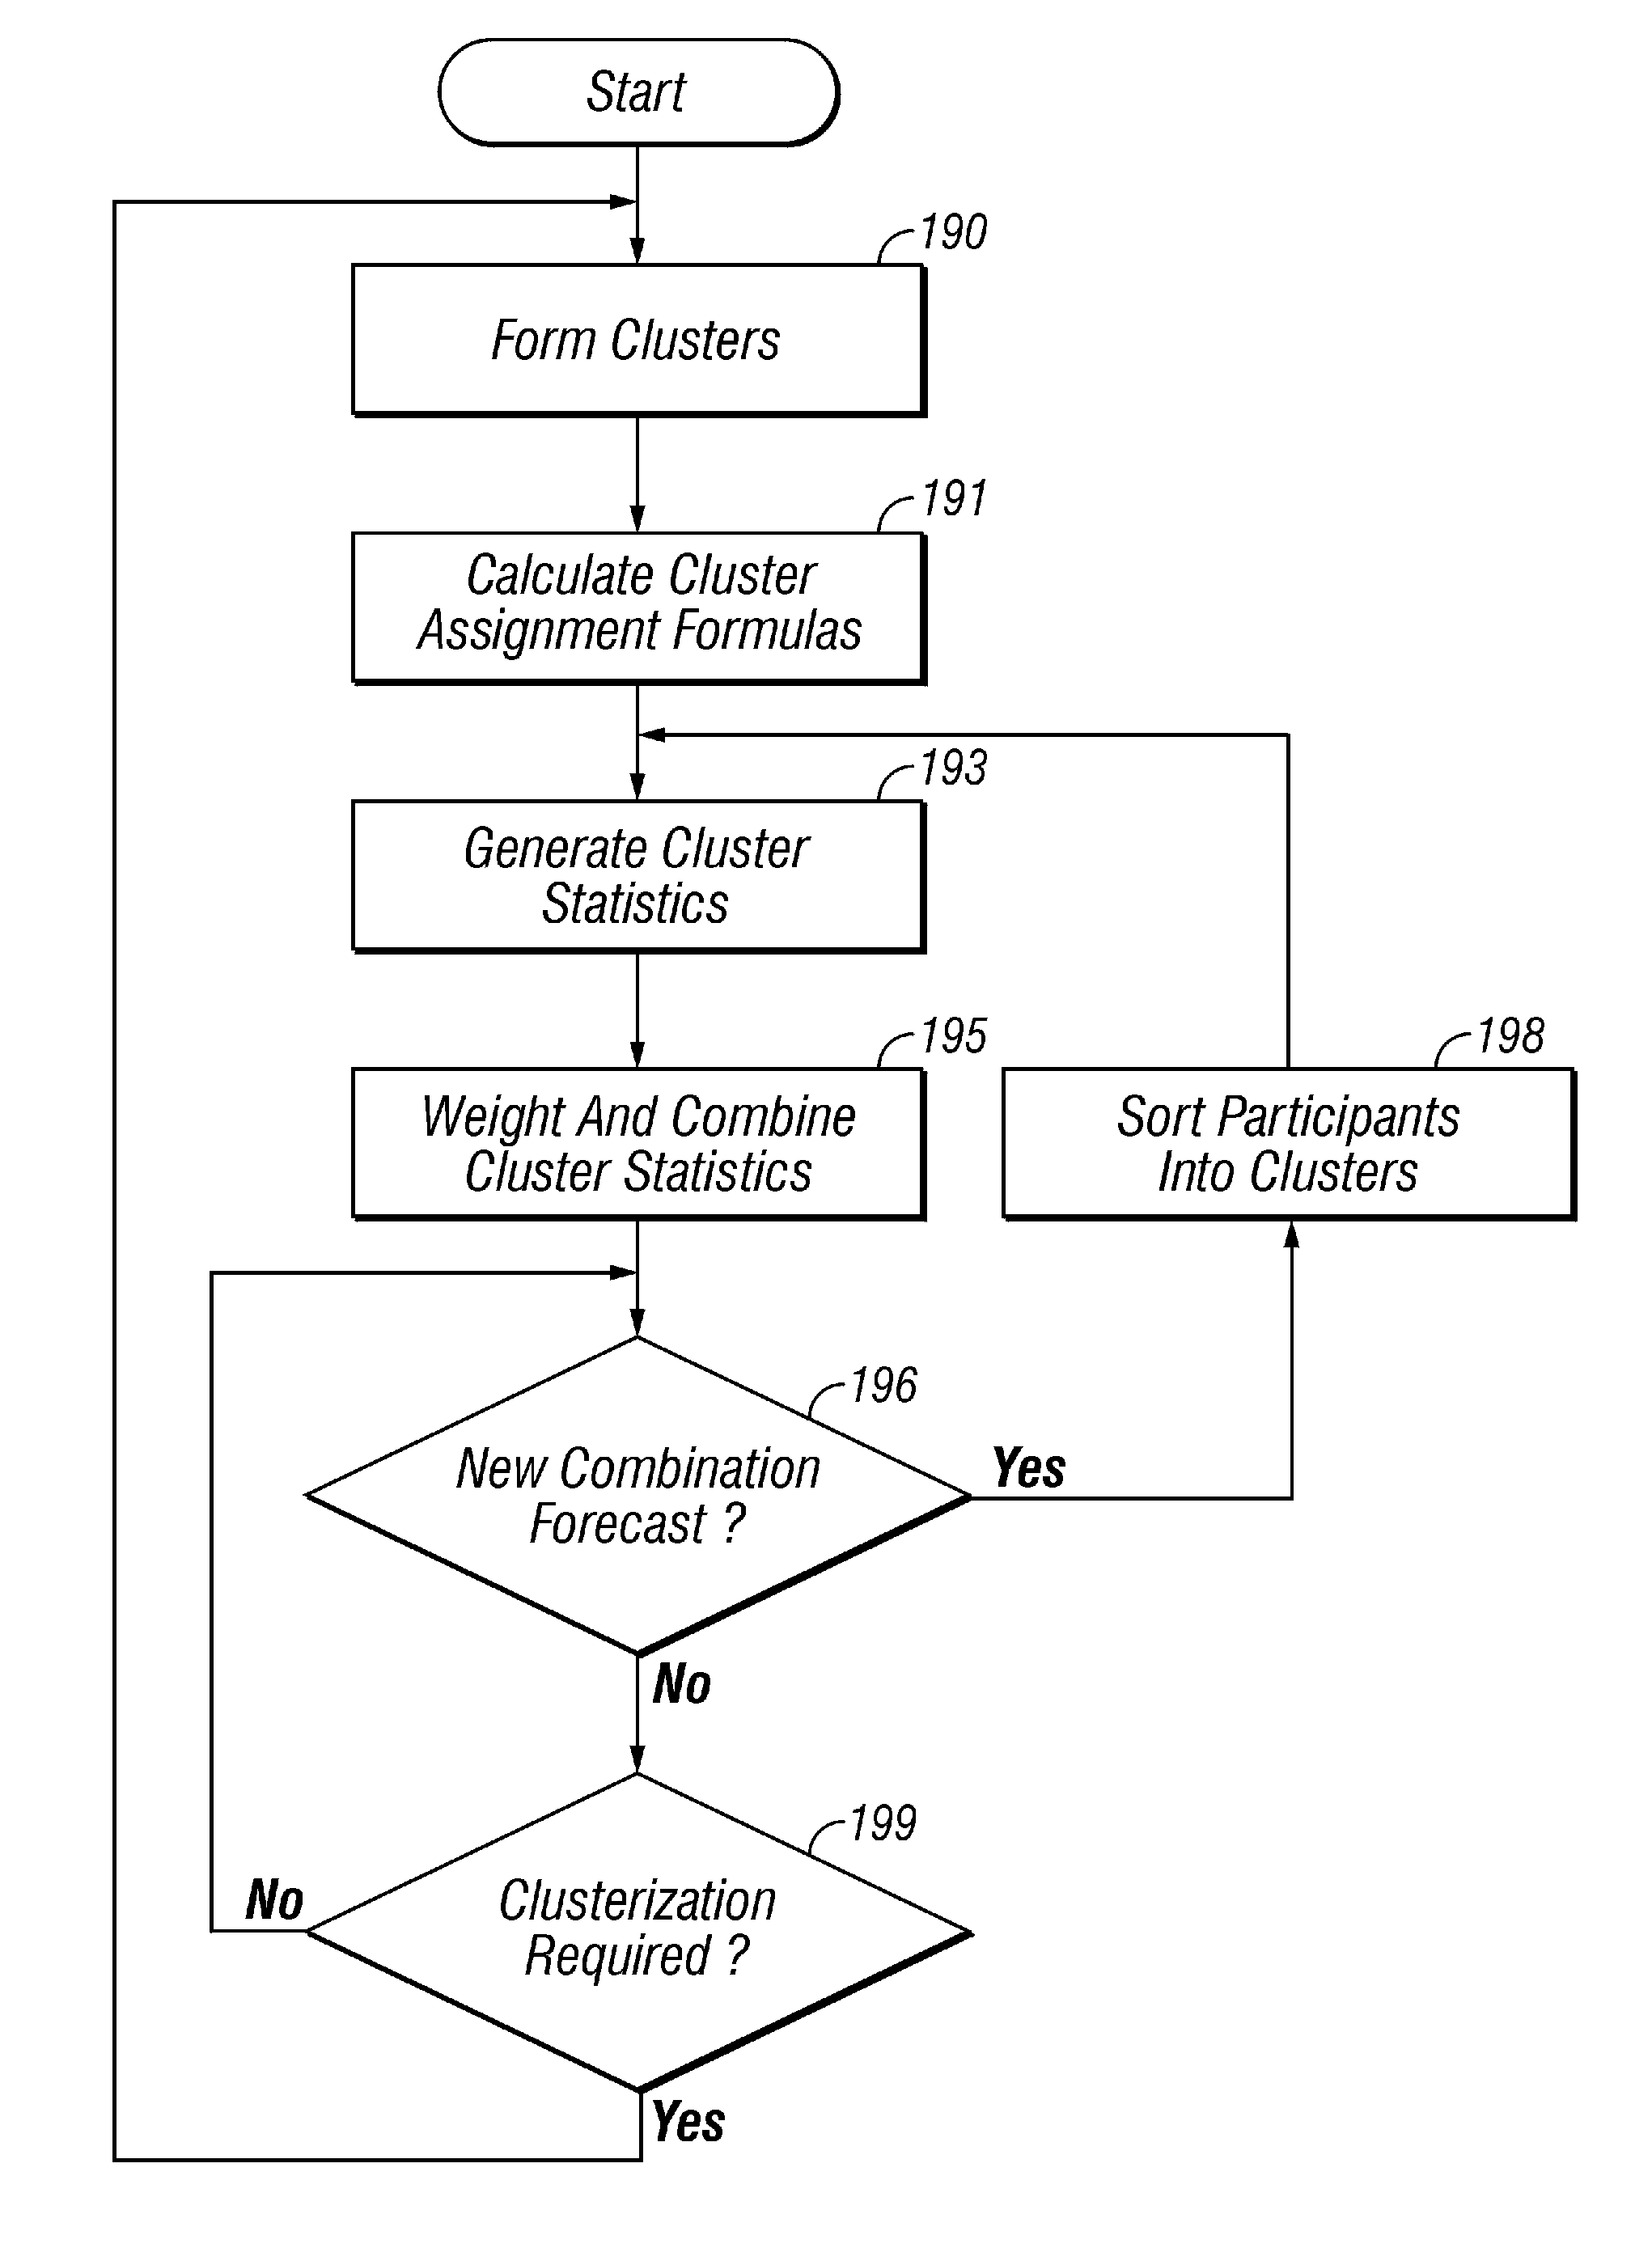
Provided are, among other things, systems, methods and techniques for forecasting information. One representative embodiment involves obtaining data that has been provided by each of a number of individual people; dividing the people into clusters by utilizing a statistical clustering technique; calculating statistics of the data in each of at least some of the clusters; and combining the statistics for such clusters so as to obtain a combination forecast.

Description

[0001]The present application is a continuation in part of U.S. patent application Ser. No. 13 / 103,742, filed May 9, 2011, which is a continuation of U.S. patent application Ser. No. 12 / 029,423, filed Feb. 11, 2008 (now U.S. Pat. No. 7,958,204), which is a division of U.S. patent application Ser. No. 11 / 344,797, filed on Jan. 31, 2006 (now abandoned), which is a division of U.S. patent application Ser. No. 09 / 392,106, filed on Sep. 8, 1999, (now U.S. Pat. No. 7,072,863). The foregoing applications are incorporated by reference herein as though set forth herein in full.FIELD OF THE INVENTION[0002]The present invention generally concerns techniques for analyzing and / or predicting information, such as consumer, political and / or societal trends, based on data obtained from a number of different people. Such data can then be used, e.g., for creating, manufacturing, providing and / or delivering products and / or services that are more useful to, or desired by, the consumers.BACKGROUNDForecas...

Claims


Application Information

Patent Timeline
IPC IPC(8): G06N3/02
CPCG06Q40/00G06Q40/06G06Q10/04
Inventor PHILLIPS, G. MICHAELJENNINGS, WILLIAM P.KLEIN, STEPHEN A.
Owner C4CAST COM
Learn More