
Method, system and computer program product for breast density classification using fisher discrimination

a computer program and density classification technology, applied in the field of automatic classification of breast density, can solve the problems of increasing the likelihood of missing the presence of breast cancer, difficult to locate ill-defined cancers, and difficult to accurately identify breast cancer from digital mammogram images, so as to remove noise and enhance the contrast of digital mammogram images

Active Publication Date: 2015-09-29
KING FAHD UNIVERSITY OF PETROLEUM AND MINERALS +1
View PDF16 Cites 2 Cited by
  • Summary
  • Abstract
  • Description
  • Claims
  • Application Information

AI Technical Summary

Benefits of technology

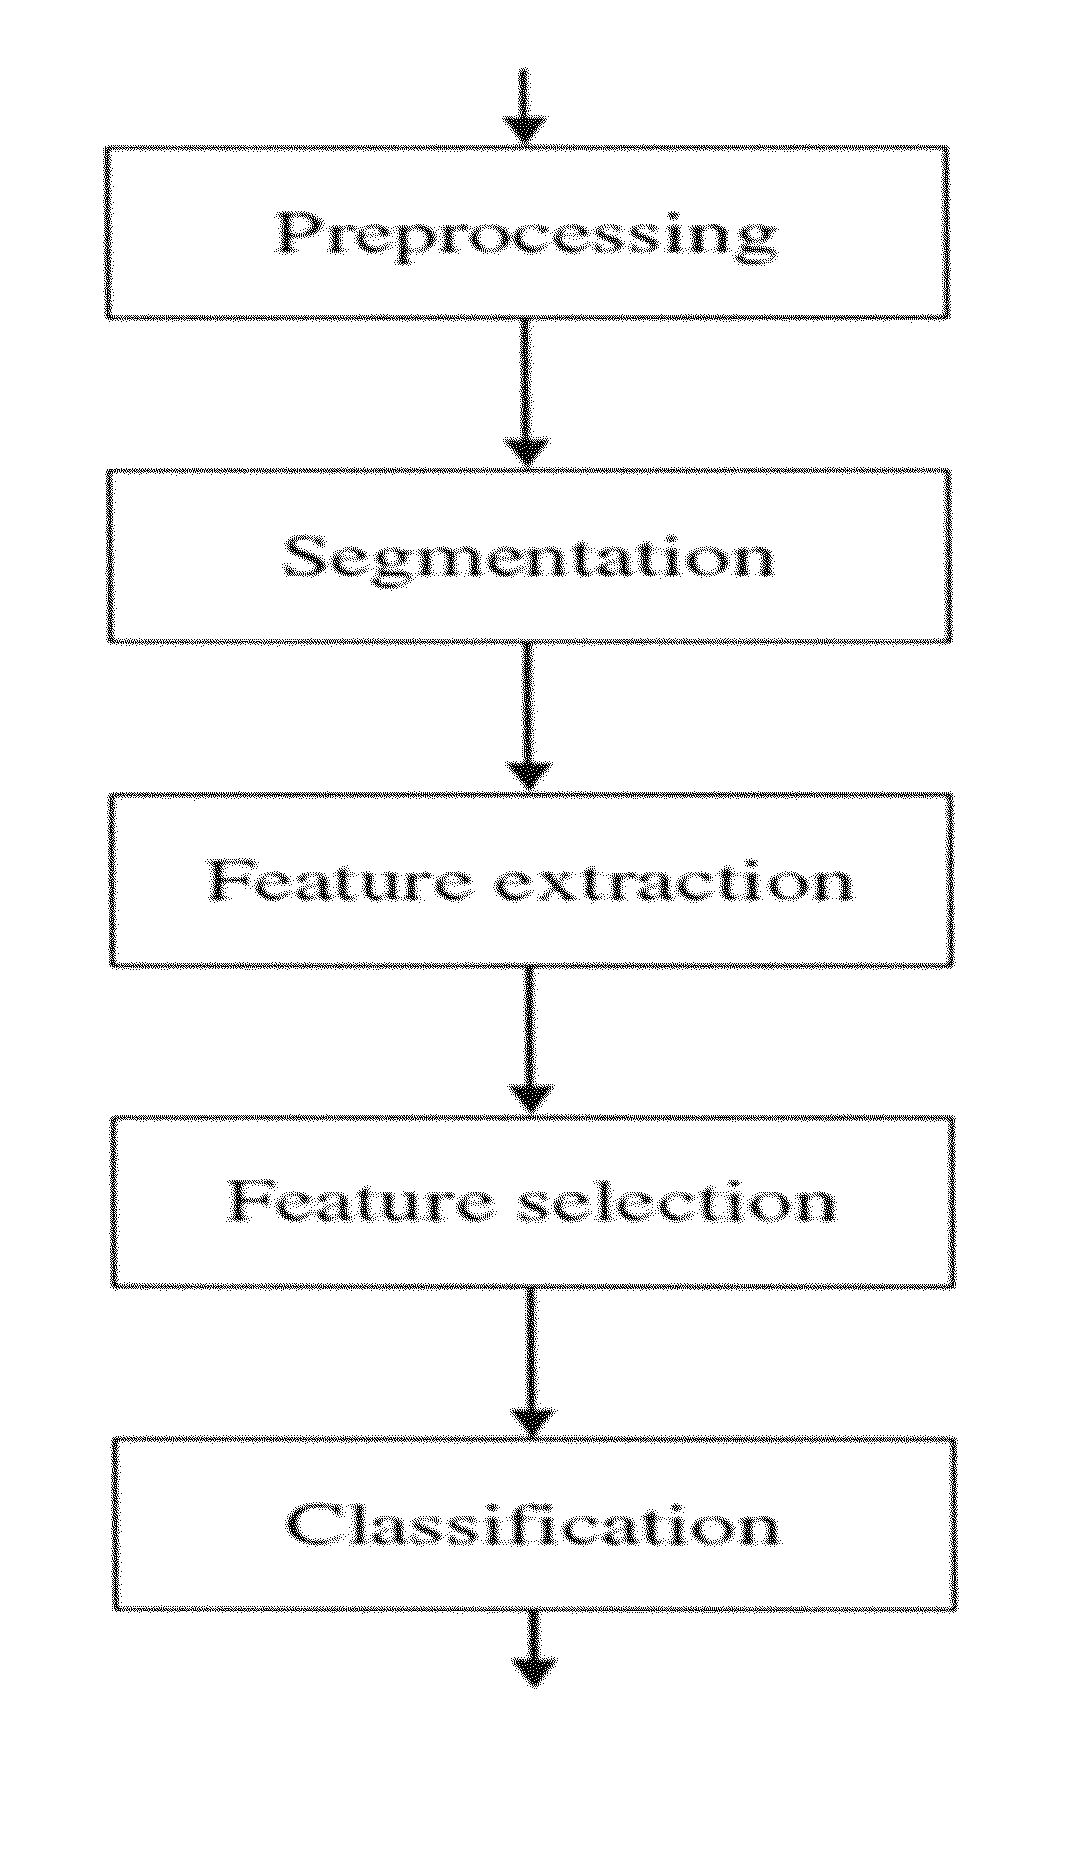
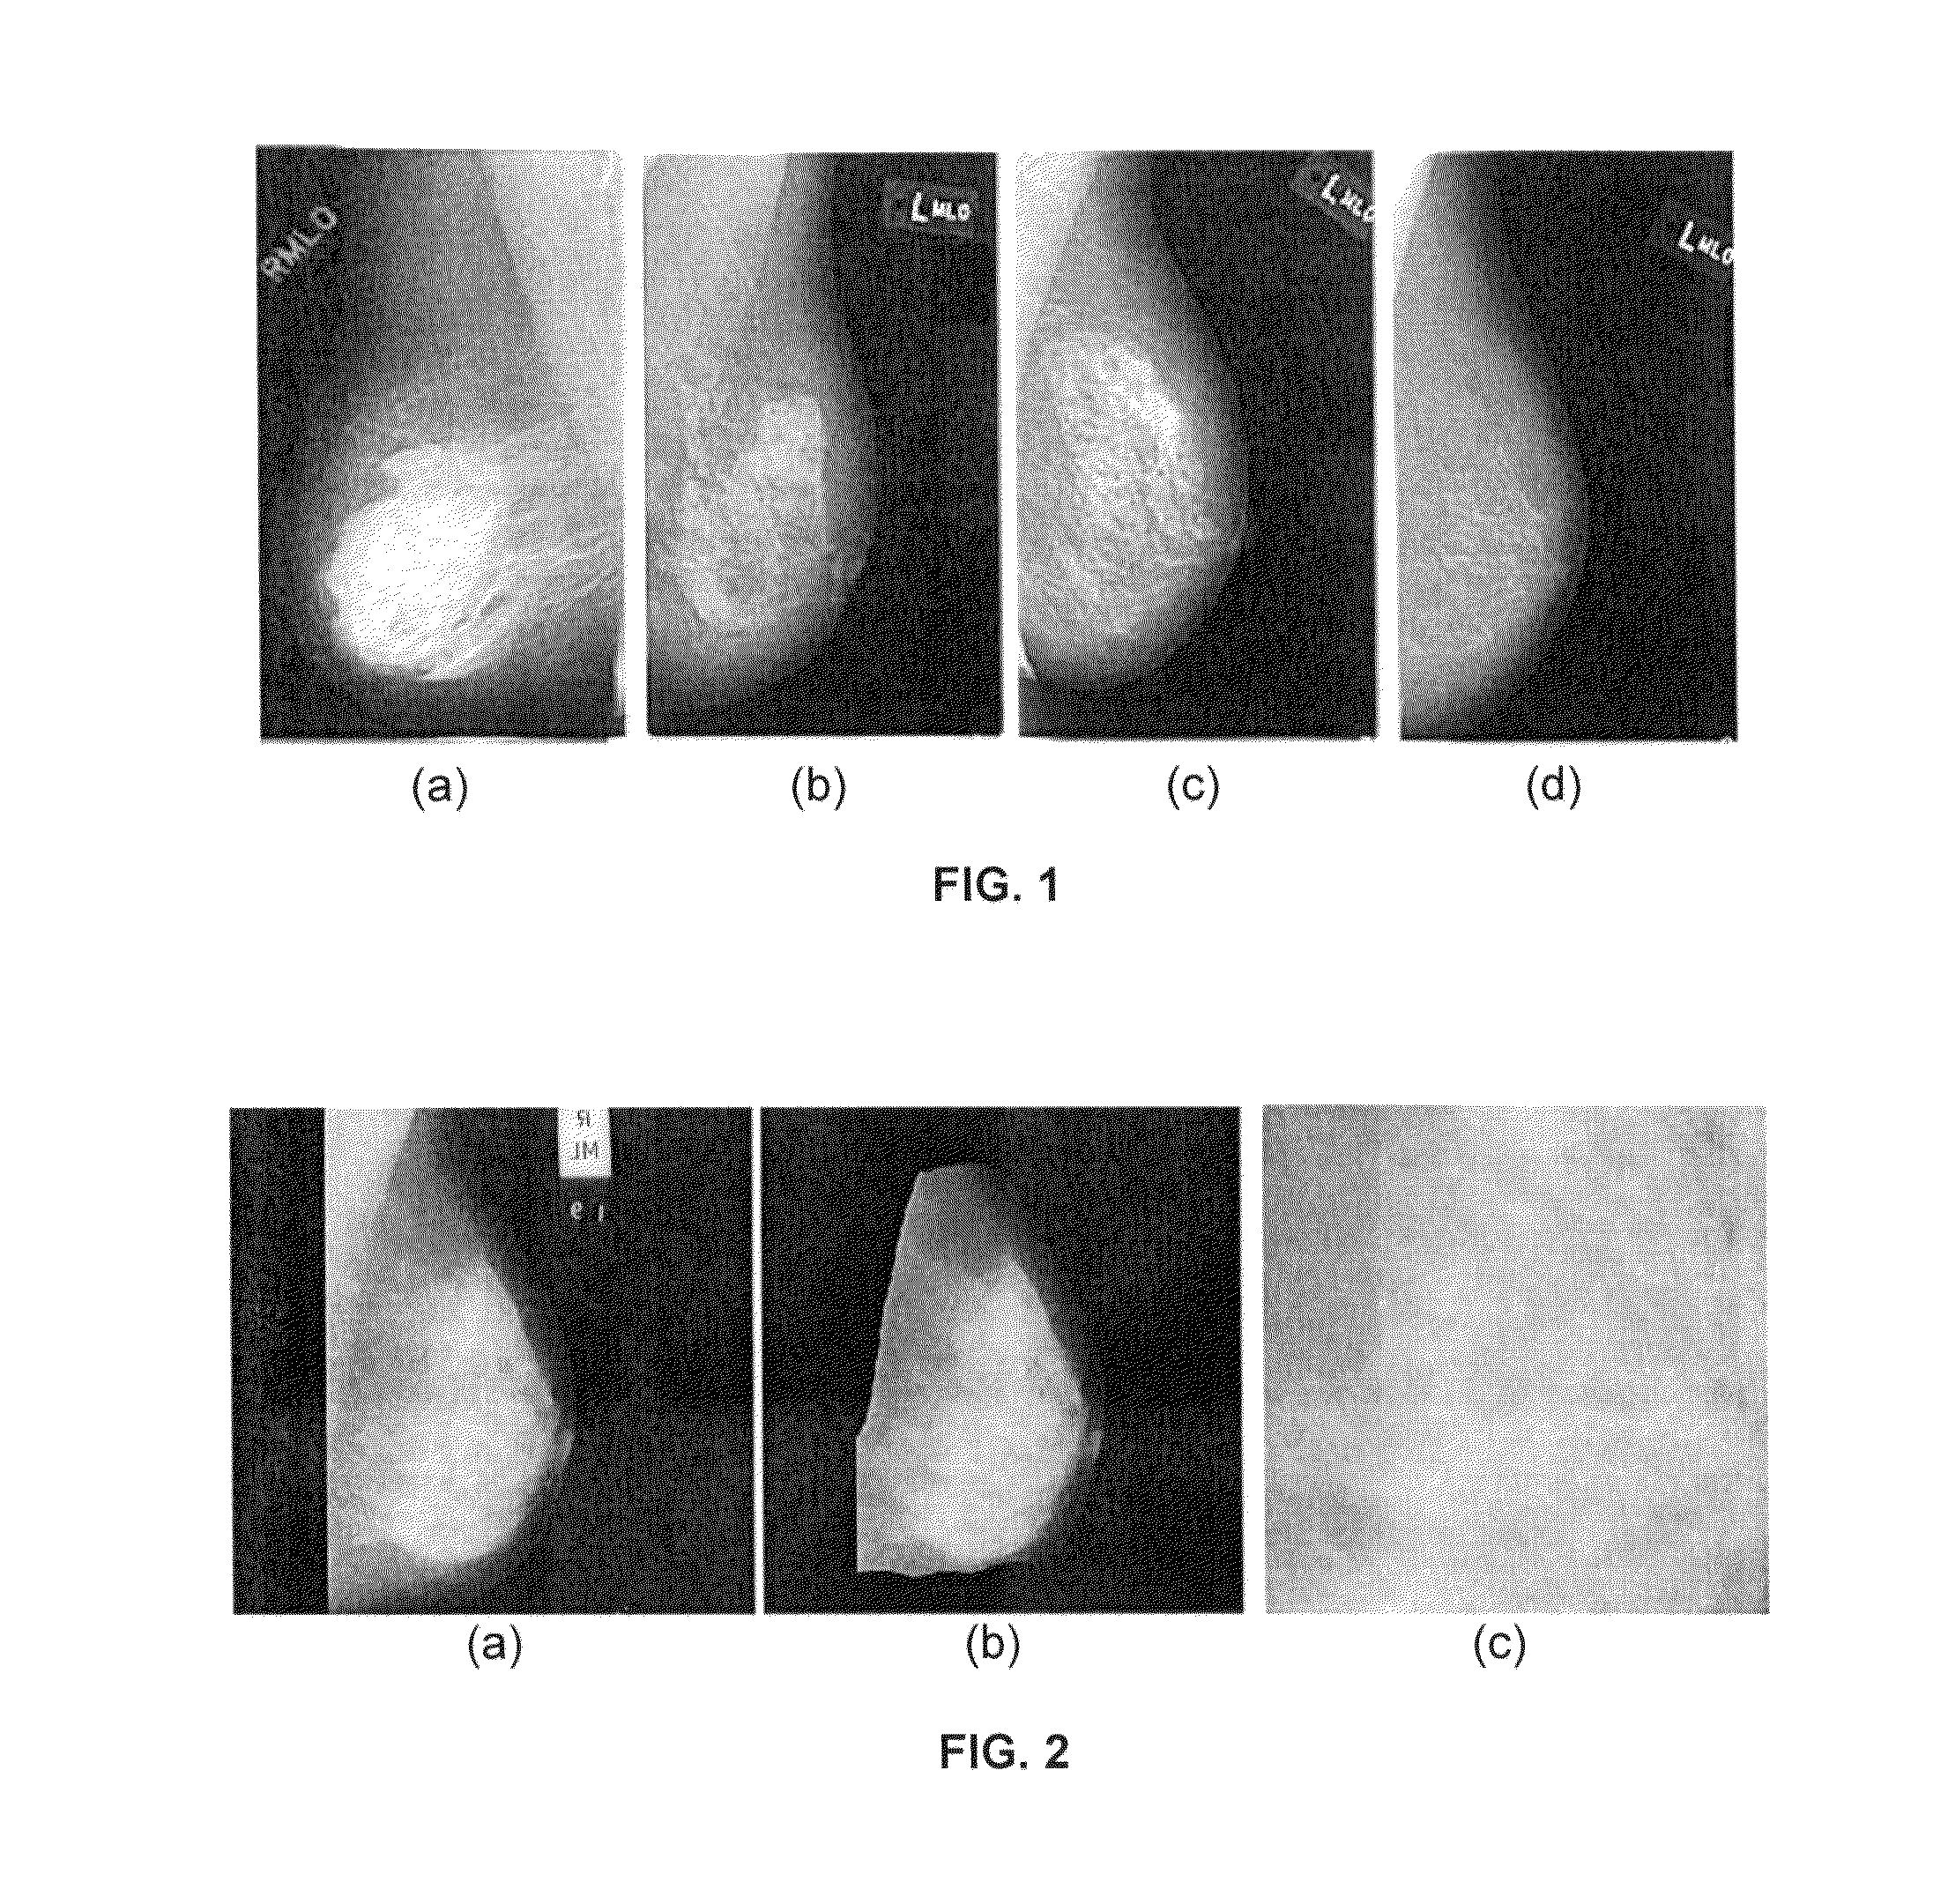
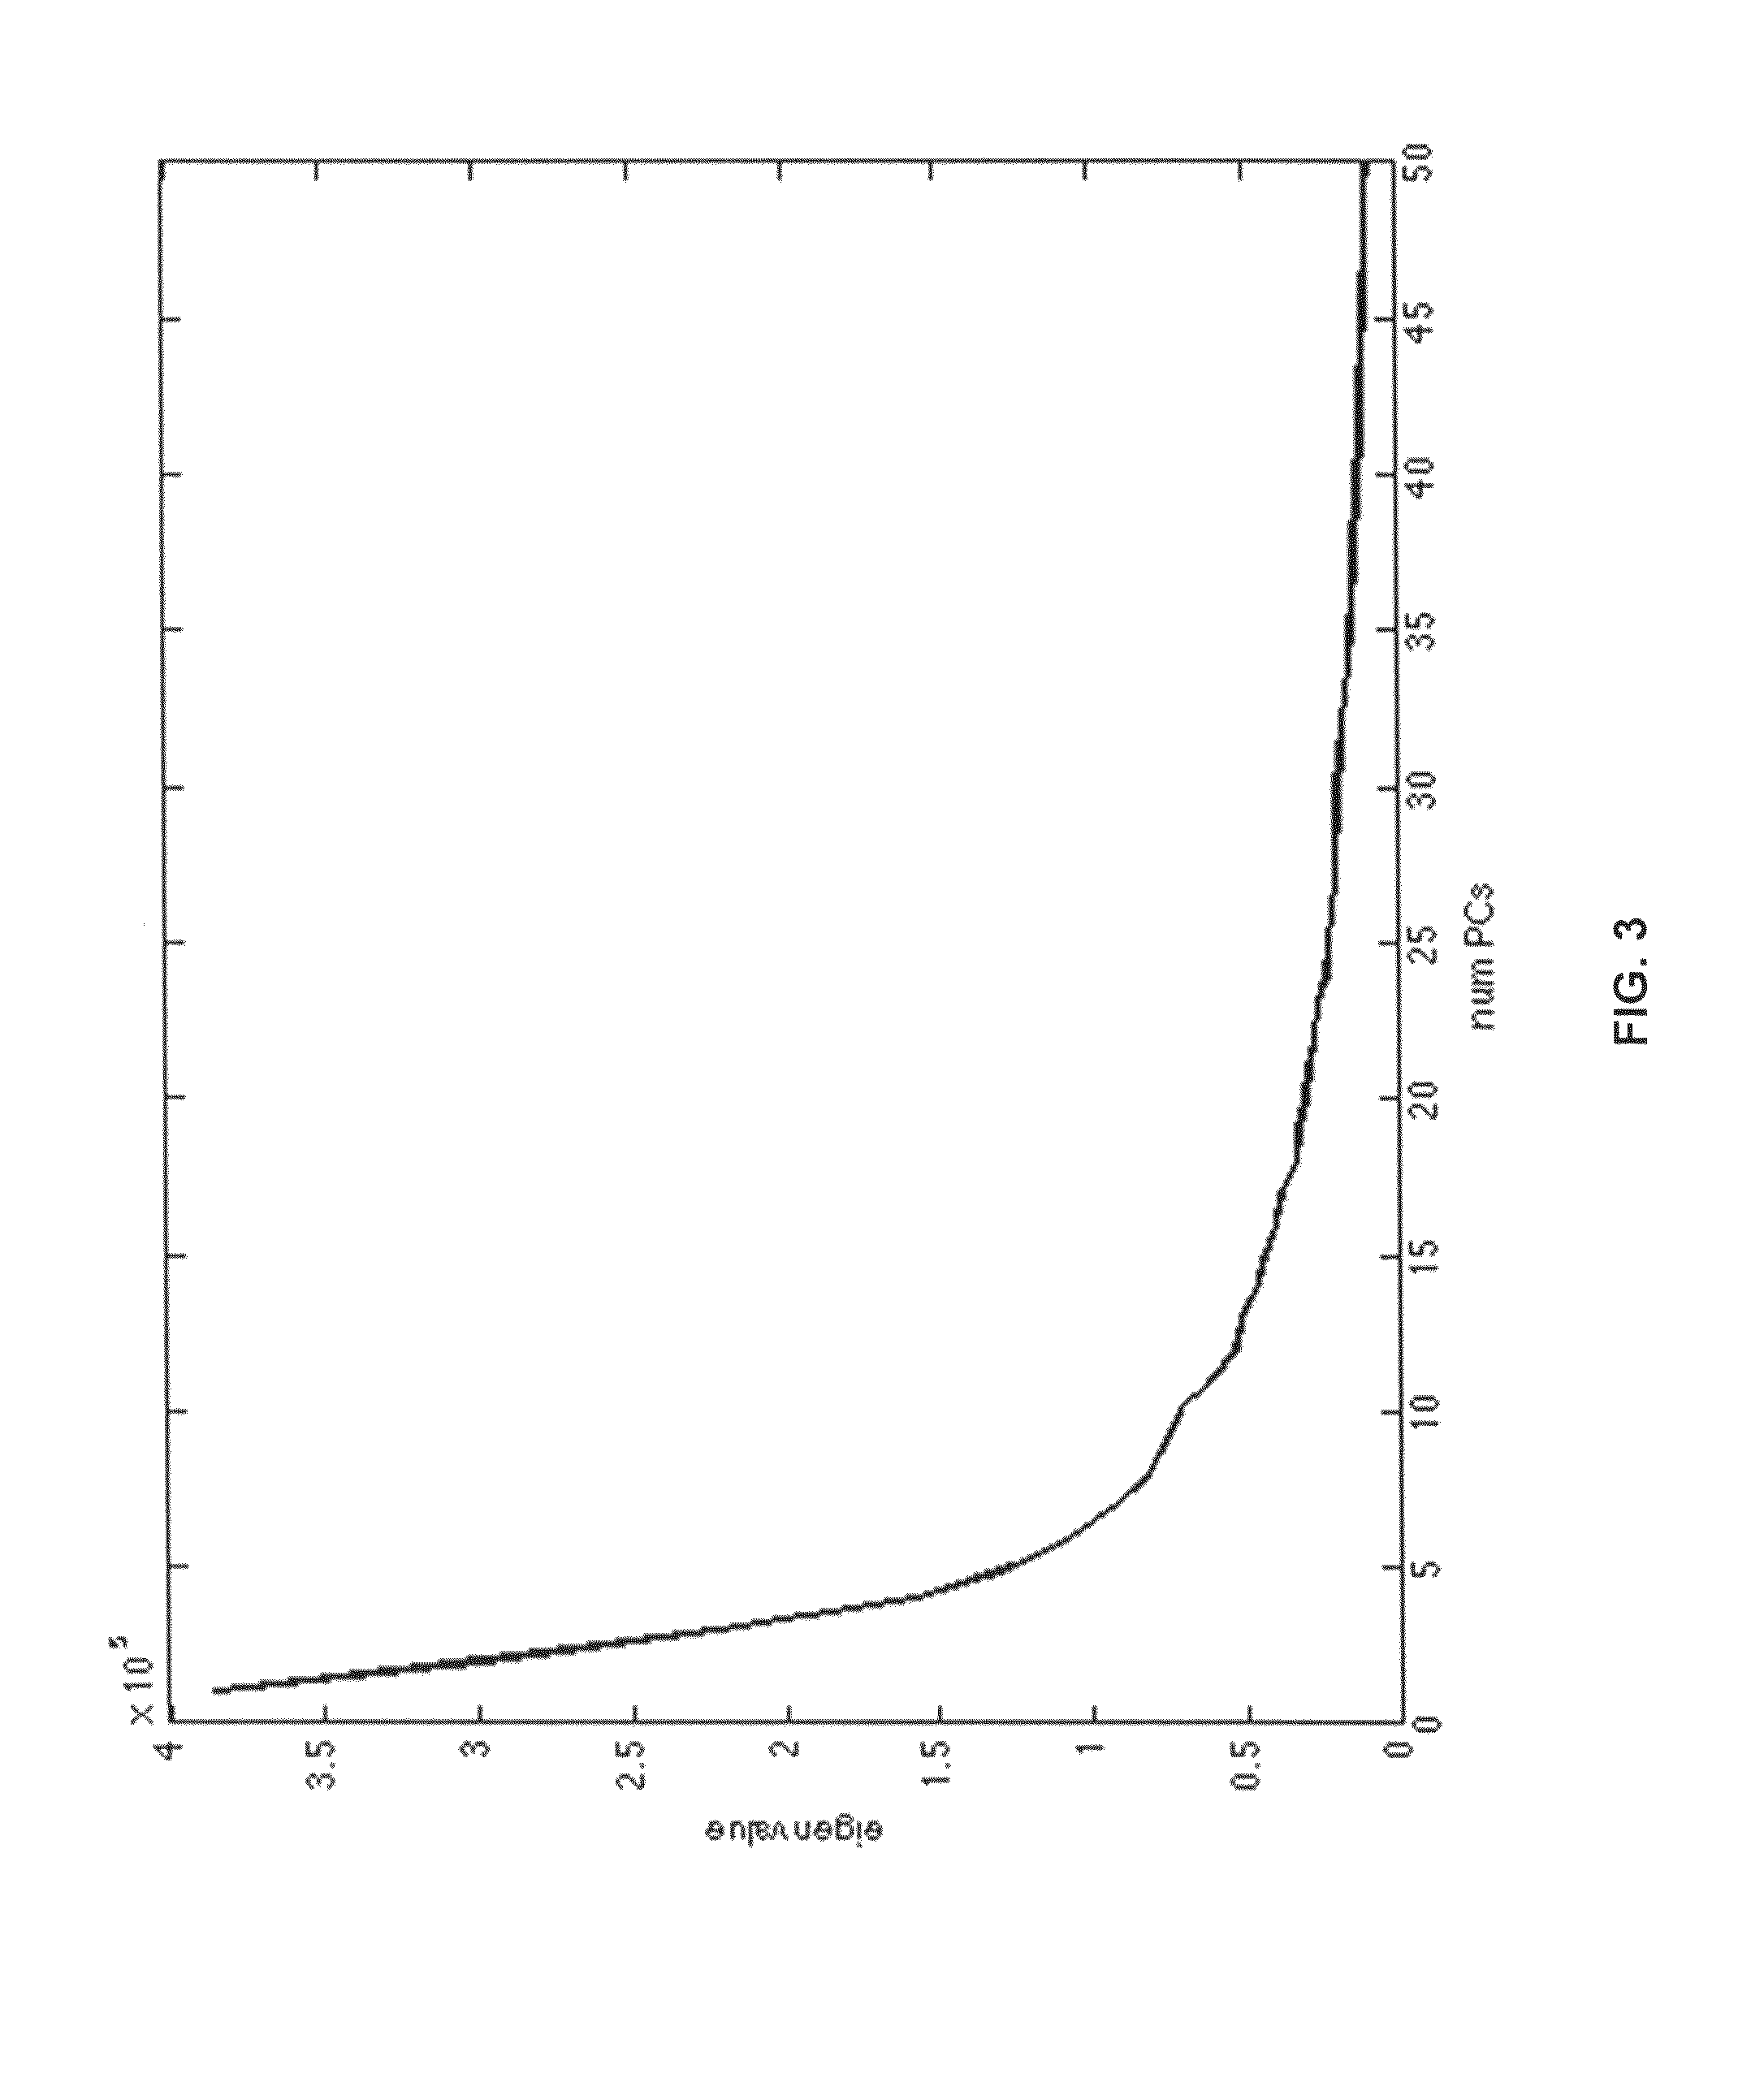
The present invention is a computer-based method for classifying breast density using mammographic imaging. The method involves removing noise, enhancing contrast, and segmenting the mammogram images to produce extracted regions of interest. These regions are then grouped together to create a larger image, which is then analyzed using principal component analysis. The resulting data is then used to classify the breast density with Fisher Linear Discriminant. Overall, this method improves the accuracy of breast density classification for diagnosis and treatment purposes.

Problems solved by technology

Although various degrees of success have been achieved in the above-mentioned detection problems, the accurate identification of breast cancer from digital mammogram images still remain a challenging and daunting task.
Based on mammogram images, the mammographic appearance of the breast widely varies which constitutes a real challenge for the radiologist exploring and / or interpreting a benign mammogram.
In such cases, the mammogram background is not uniform and, therefore, it is very difficult to locate ill-defined cancers.
On the other hand, the presence of breast cancer is often masked in a mammogram having a dense tissue which increases the likelihood of missing the presence of breast cancer.
Therefore, the challenge is doubled for women by being at higher risk of the disease and higher risk of cancer misdiagnosis by the mammographic approach.
However, it should be noted that additional screening will also greatly increase the likelihood of false alarms leading to unnecessary biopsies and the overall cost of screening approach.

Method used


Image

  • Method, system and computer program product for breast density classification using fisher discrimination
  • Method, system and computer program product for breast density classification using fisher discrimination
  • Method, system and computer program product for breast density classification using fisher discrimination

Examples


Embodiment Construction

[0030]Referring now to the drawings, wherein like reference numerals designate identical or corresponding parts throughout the several views. In medical content-based information retrieval (Med-CBIR) systems, the access to information is performed by the visual attributes extracted from images. The definition of a set of features, capable to describe effectively each region contained in an image, is one of the most complex tasks in the analysis of images. In addition, the process of characterization affects all the subsequent process of a Med-CBIR system (U.S. Cancer Statistics Working Group. United States Cancer Statistics: 1999-2008 Incidence and Mortality Web-based Report. Atlanta: U.S. Department of Health and Human Services, Centers for Disease Control and Prevention and National Cancer Institute; 2012. Available at: www.cdc.gov / uscs—incorporated herein by reference in its entirety). An image can be numerically represented by a feature vector, which should reduce the dimensiona...


PUM


Abstract

A method for content-based image retrieval for the classification of breast density from mammographic imagery is described. The breast density is characterized through the Fisher linear discriminants (FLD) extracted from the Principal Component Analysis (PCA). Unlike PCA, the FLD provides a very discriminative representation of the mammographic images in terms of the breast density. Various exemplary methods, systems and computer program products are also disclosed.

Description

BACKGROUND OF THE INVENTION[0001]1. Technical Field[0002]The present invention relates to a method, a system and a computer program product for the classification of breast density from mammographic imagery. Specifically, the invention relates to an automated content-based image retrieval (CBIR) method, system and computer program product for the classification of breast density in mammogram images.[0003]2. Description of the Related Art[0004]The “background” description provided herein is for the purpose of generally presenting the context of the disclosure. Work of the presently named inventors, to the extent it is described in this background section, as well as aspects of the description which may not otherwise qualify as prior art at the time of filing, are neither expressly or impliedly admitted as prior art against the present invention.[0005]In a study covering data population from 1975-1988, the US National Cancer Institute (NCI) estimates that the overall lifetime risk for...

Claims


Application Information

Patent Timeline
Patent Type & Authority Patents(United States)
IPC IPC(8): G06K9/00G06T7/00G06T5/00A61B5/00
CPCG06T7/0012G06T7/0028G06T7/0081G06T7/0097G06T5/002G06T5/003A61B5/4312A61B5/7225A61B5/7267A61B5/7203A61B5/0013A61B5/002G06T2200/28G06T2207/10116G06T2207/30068G06T2207/30196G06T2210/41A61B2560/0475A61B2576/02G06T2207/20076G16H30/40G06T7/11G06F16/583G06F18/24G06T5/00G06T11/60
Inventor GHOUTI, LAHOUARI
Owner KING FAHD UNIVERSITY OF PETROLEUM AND MINERALS
Learn More