Method for reconstructing the total organic carbon content from compositional modeling analysis
a composition modeling and total organic carbon technology, applied in the field of methods for reconstructing the total organic carbon content from composition modeling analysis, can solve the problem that none of the prior art methods can provide a detailed pictur
- Summary
- Abstract
- Description
- Claims
- Application Information
AI Technical Summary
Benefits of technology
Problems solved by technology
Method used
Image
Examples
example 1
[0153]The following example of the method of the present invention uses the compositional modeling analysis method based on POPI data to calculate reconstructed total organic carbon (TOC) values. It has been found that reconstructed TOC values closely correspond to TOC measurements by standard instruments. The method of the invention can be used in unconventional oil reservoirs to provide relevant data in real time at the well site for use in making operational decisions while drilling. In addition to providing TOC data, the method also provides data that discriminates among the organic matter found the reservoir rock, such as free oil, residual bitumen and kerogen.
[0154]The data for this example is based upon data derived from core samples collected from an Arabian well identified as DBYT-1 that were analyzed for TOC and also by standard POPI analysis. The POPI data were processed by the GC-ROX™ commercial software available from the Saudi Arabian Oil Company and the compositional ...
example 2 and 3
[0166]The method described above was applied to samples from the DBYT-1 and AMAD-2 wells to yield the results set forth in Table 2 shown in FIGS. 12A-B and Table 3 shown in FIGS. 13A-B, respectively.
[0167]FIG. 14 is a cross-plot of instrument measurements of the TOC versus reconstructed TOC (TOCRCN) from the DBYT-1 well data reported in Table 2 and FIG. 6 is a cross plot of instrument measurements of the TOC versus reconstructed TOC (TOCRCN) from the AMAD-2 Well data reported in Table 3. The plots of FIGS. 14 and 15 demonstrate that TOC calculations that are reconstructed from compositional modeling provide a very close correlation to TOC values that are based on instrument measurements. The least squares fit of the line for the respective plots were as follows: DBYT-1, the R2=0.9418 and for AMAD-2 the R2=0.9493.
example 4
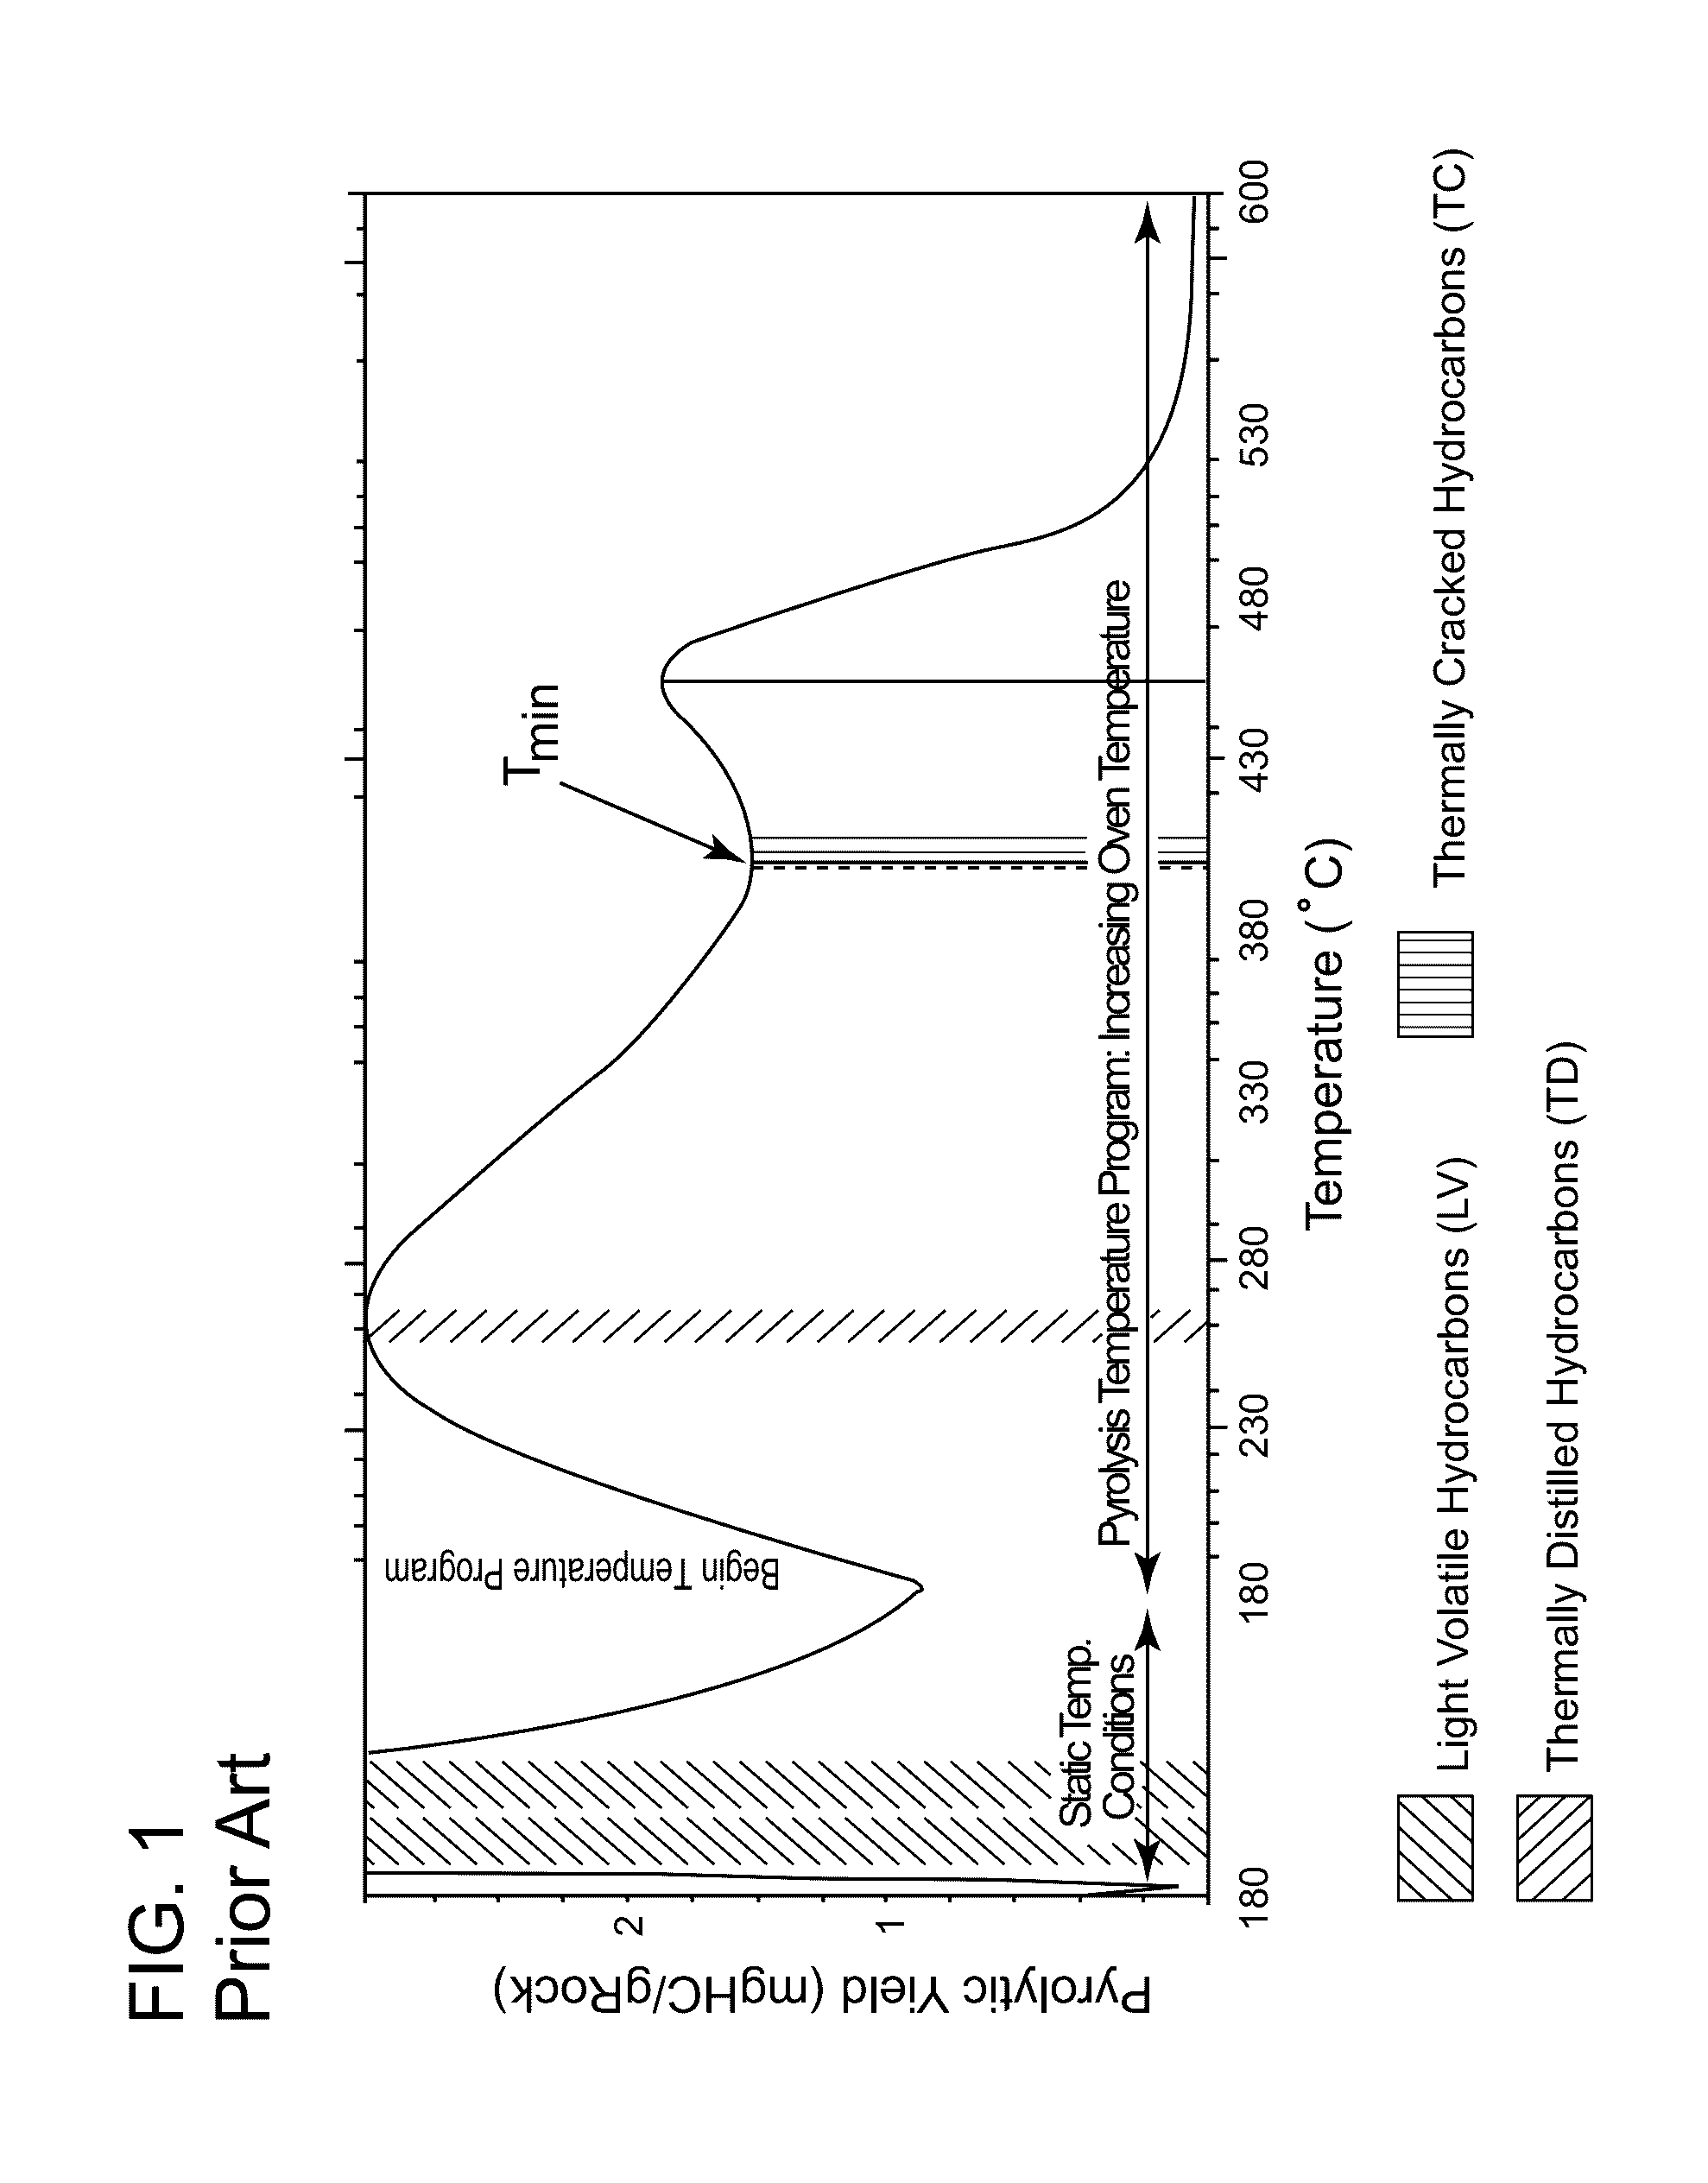
[0168]An example of the improved interpretations provided through the reconstructed TOC method is illustrated by comparison of data from the DBYT-1 well to another potential unconventional oil resource well (MZLJ-29). FIG. 16 is a plot of the pyrogram for a representative sample from DBYT-1 produced during standard Rock-Eval analysis; i.e., using a starting temperature of 300° C. to capture the S1 hydrocarbon yield (in mg hydrocarbons / g Rock) and then programmed pyrolysis at 25° C. / minute to 600° C. to capture the S2 hydrocarbon yield. As mentioned previously, the S1 hydrocarbon yield is commonly taken as representative of the “Free Oil” content of a sample. For example, see Jarvie, Daniel M., 2012, Shale resource systems for oil and gas: Part 1—Shale gas resource systems; Part 2—Shale oil resource systems, AAPG Memoir 97, p. 69-119.
[0169]FIG. 17 is the corresponding plot for a representative sample from MZLJ-29. The corresponding parameters commonly used for source rock / unconventio...
PUM
| Property | Measurement | Unit |
|---|---|---|
| static temperature | aaaaa | aaaaa |
| static temperature | aaaaa | aaaaa |
| temperature | aaaaa | aaaaa |
Abstract
Description
Claims
Application Information
 - R&D
- Intellectual Property
- Life Sciences
- Materials
- Tech Scout
- Unparalleled Data Quality
- Higher Quality Content
- 60% Fewer Hallucinations
Browse by: Latest US Patents, China's latest patents, Technical Efficacy Thesaurus, Application Domain, Technology Topic, Popular Technical Reports.
© 2025 PatSnap. All rights reserved.Legal|Privacy policy|Modern Slavery Act Transparency Statement|Sitemap|About US| Contact US: help@patsnap.com


