Method and system for integrating logging tool data and digital rock physics to estimate rock formation properties

a technology of digital rock physics and tool data, applied in the field of methods and systems for integrating logging tool data and digital rock physics to estimate rock formation properties, can solve the problems of difficult core analysis (scal) for relative permeability and capillary pressure, inability to directly determine permeability, and inability to replace controlled laboratory measurements

Active Publication Date: 2016-11-29
HALLIBURTON ENERGY SERVICES INC
View PDF78 Cites 74 Cited by
  • Summary
  • Abstract
  • Description
  • Claims
  • Application Information

AI Technical Summary

Benefits of technology

[0056]A feature of the present invention is obtaining a rock sample from a logging tool such as a sidewall plug or large enough cutting extracted by the logging tool in the same well interval that the logging tool measures fluid properties. The rock samples thus obtained are scanned using a computer tomographic (CT) scanner, scanning electron microscope (SEM), or other suitable scanning device. The resulting scanned rock image is segmented and rock properties comprising porosity, absolute permeability, relative permeability, capillary pressure, and / or other relevant rock properties are calculated. The integration of enhanced digital rock physics techniques with downhole well logging according to the present invention can correct and / or support upscaling of the well logging results relative to the rock formation of interest.

Problems solved by technology

Even if well tests are conducted, the permeability cannot be directly derived simply because the formation response to pressure and fluid flux variations that include, permeability, and a number of other quantities, such as porosity, fluid and formation compressibility, and reservoir geometry.
These tests cannot replace controlled laboratory measurements where the absolute and relative permeability are measured on a set of samples covering ranges of porosity and mineralogy and at varying fluid content inside the pores space.
The problem is that in order to conduct controlled experiments in the physical laboratory to cover a relevant range of rock property variation, a fairly large set (>20) of well preserved and regularly shaped plugs at least an inch in length and diameter is required.
Even if such plugs are available, conducting special core analysis (SCAL) for relative permeability and capillary pressure is extremely difficult and requires a long time, from weeks to months.
Obviously, if the formation's pore space is completely filled with water, such a formation will not produce oil or gas and is of no interest.
The LWD method is susceptible to effects such as tool position within the borehole and making the measurements in a relatively new borehole prior to drilling fluids entering the formation.
However, the recognition of pay zones within a rock formation is difficult because the conductivity difference between capillary-bound water and displaceable water cannot be measured.
In addition, resistivity measurements are subject to borehole rugosity and mudcake effects.
Even after cross plot corrections, borehole rugosity, mudcake, lithology and other environmental effects can adversely effect the measurement.
Each of the above models has drawbacks in their application.
It is well known that models designed to work in a consistent lithology will not yield an accurate result where the formation is thinly laminated with the layers each having differing porosity and permeability characteristics.
Formation test tools are generally incapable of measuring anisotropic permeability, i.e., vertical versus horizontal permeability.
An additional downside to using formation test tools is the fact that logging tool movement must be stopped to permit the formation test tool to come into contact with the formation, perform the draw down and permit the pressure to build back up.
This results in costs in addition to the cost of services associated with logging.
Thus, while providing some information regarding permeability, formation test tools are costly to use when compared to NMR logging tools.
At the same time, NMR logging tools make certain assumptions regarding permeability that may not be accurate in light of actual formation conditions.
These lab tests are subject to error due to transport and changes of the material properties that may occur in replicating downhole conditions.
In addition, it is well known that the fluid in a well or formation is not homogeneous and the fluid properties vary in both time and depth location.
Multiple samples can be taken but this requires significant time and expense.
Many factors such as contamination of fluids with drilling mud and non-representative sample locations can introduce significant errors in the logging tool estimates of relative permeability.
Some disadvantages of logging techniques per se can include, for example, the following.
As a result, the estimates of permeability and relative permeability are subject to significant error and variability.
As such they lack forecasting power to predict how the reservoir behaves at different stages of development as fluid saturations and fluid properties change versus pressure and temperature.
5. Fluid samples taken with logging tools may be contaminated with drilling fluid when the samples are taken on a newly drilled well.
The irregularity of the surface at the well bore can interfere with this seal.
In addition, tight formations such as carbonates or shales require high pressures to inject or withdraw formation fluid samples.
In these cases a tight seal is very difficult to achieve.
Some disadvantages of digital rock physics per se can include, for example, the following.
Reliance on such correlations is perceived as risky or error prone by some well operators.
There is no way to concretely verify these estimates.

Method used


Image

  • Method and system for integrating logging tool data and digital rock physics to estimate rock formation properties
  • Method and system for integrating logging tool data and digital rock physics to estimate rock formation properties
  • Method and system for integrating logging tool data and digital rock physics to estimate rock formation properties

Examples


example 1

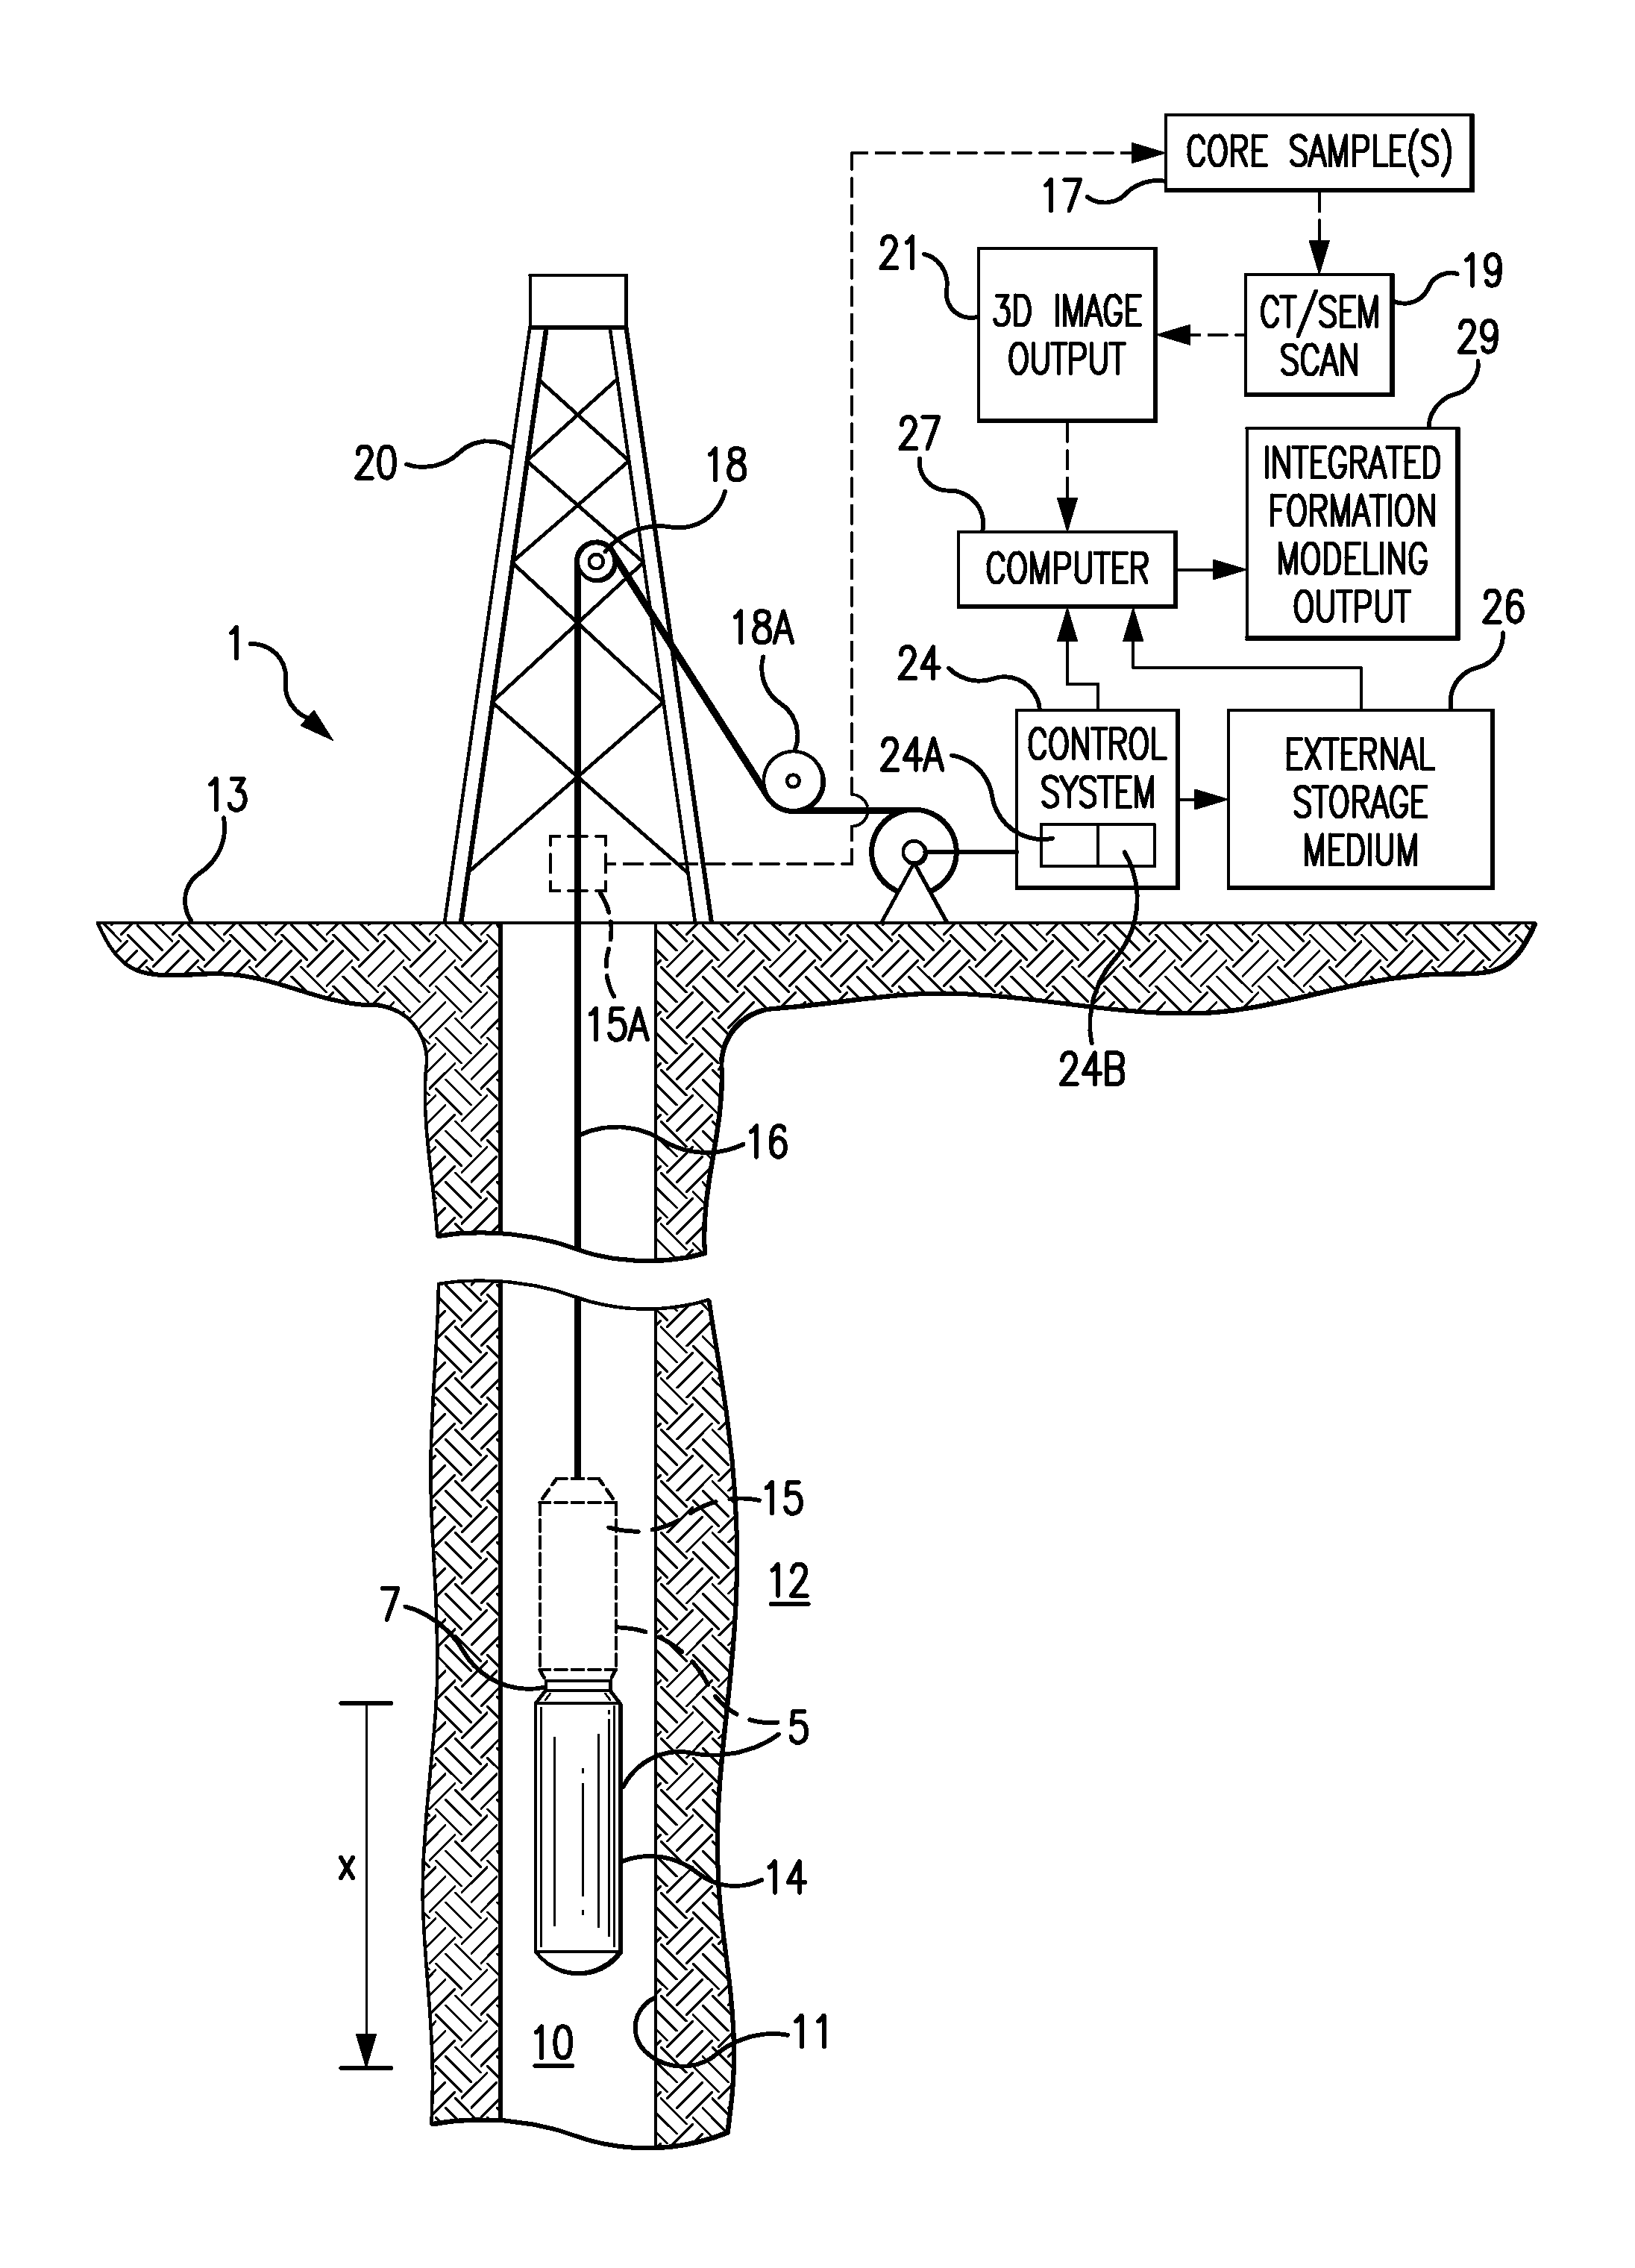
[0223]An example of rebuilding the physical properties of rock of a well interval, such as from core or drill cuttings retrieved from the interval of interest, is the following.

[0224]1. Collect a number of relatively large (˜1 mm) cuttings or core samples from the interval of interest where logging has been conducted or a core extracted.

[0225]2. Produce a CT Image of the cuttings and segment these images.

[0226]3. Bring these images to in-situ conditions.

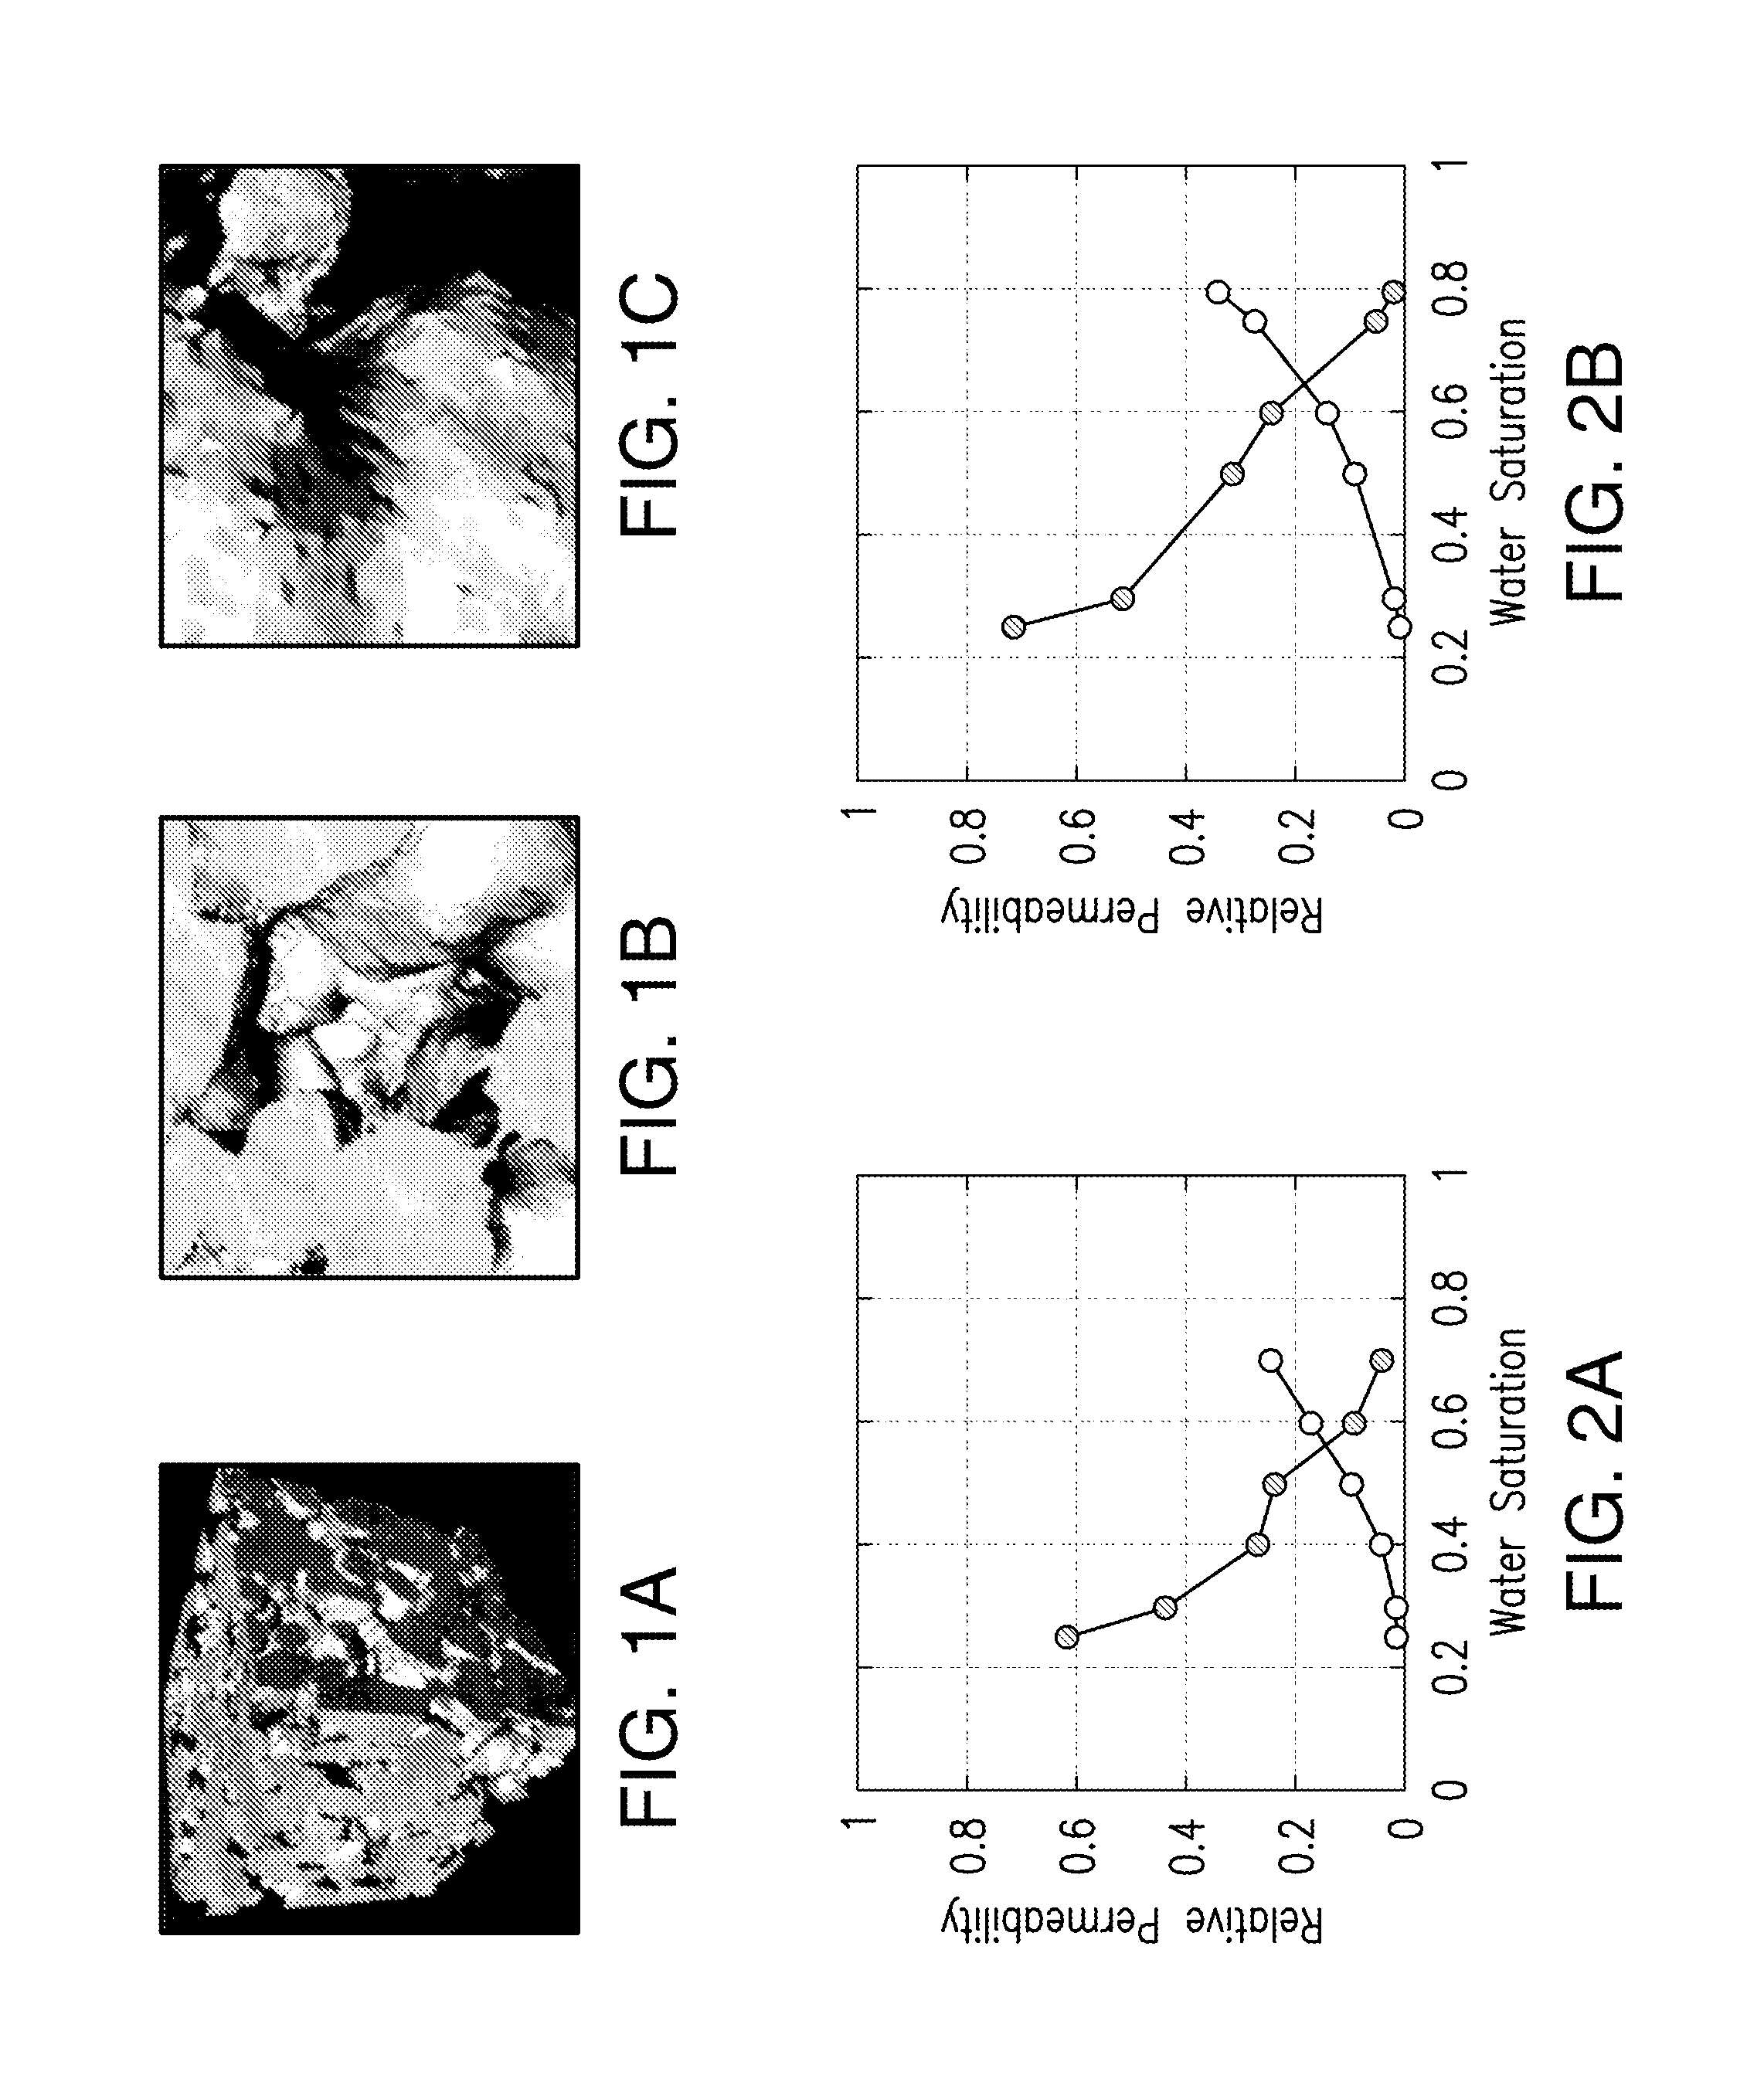
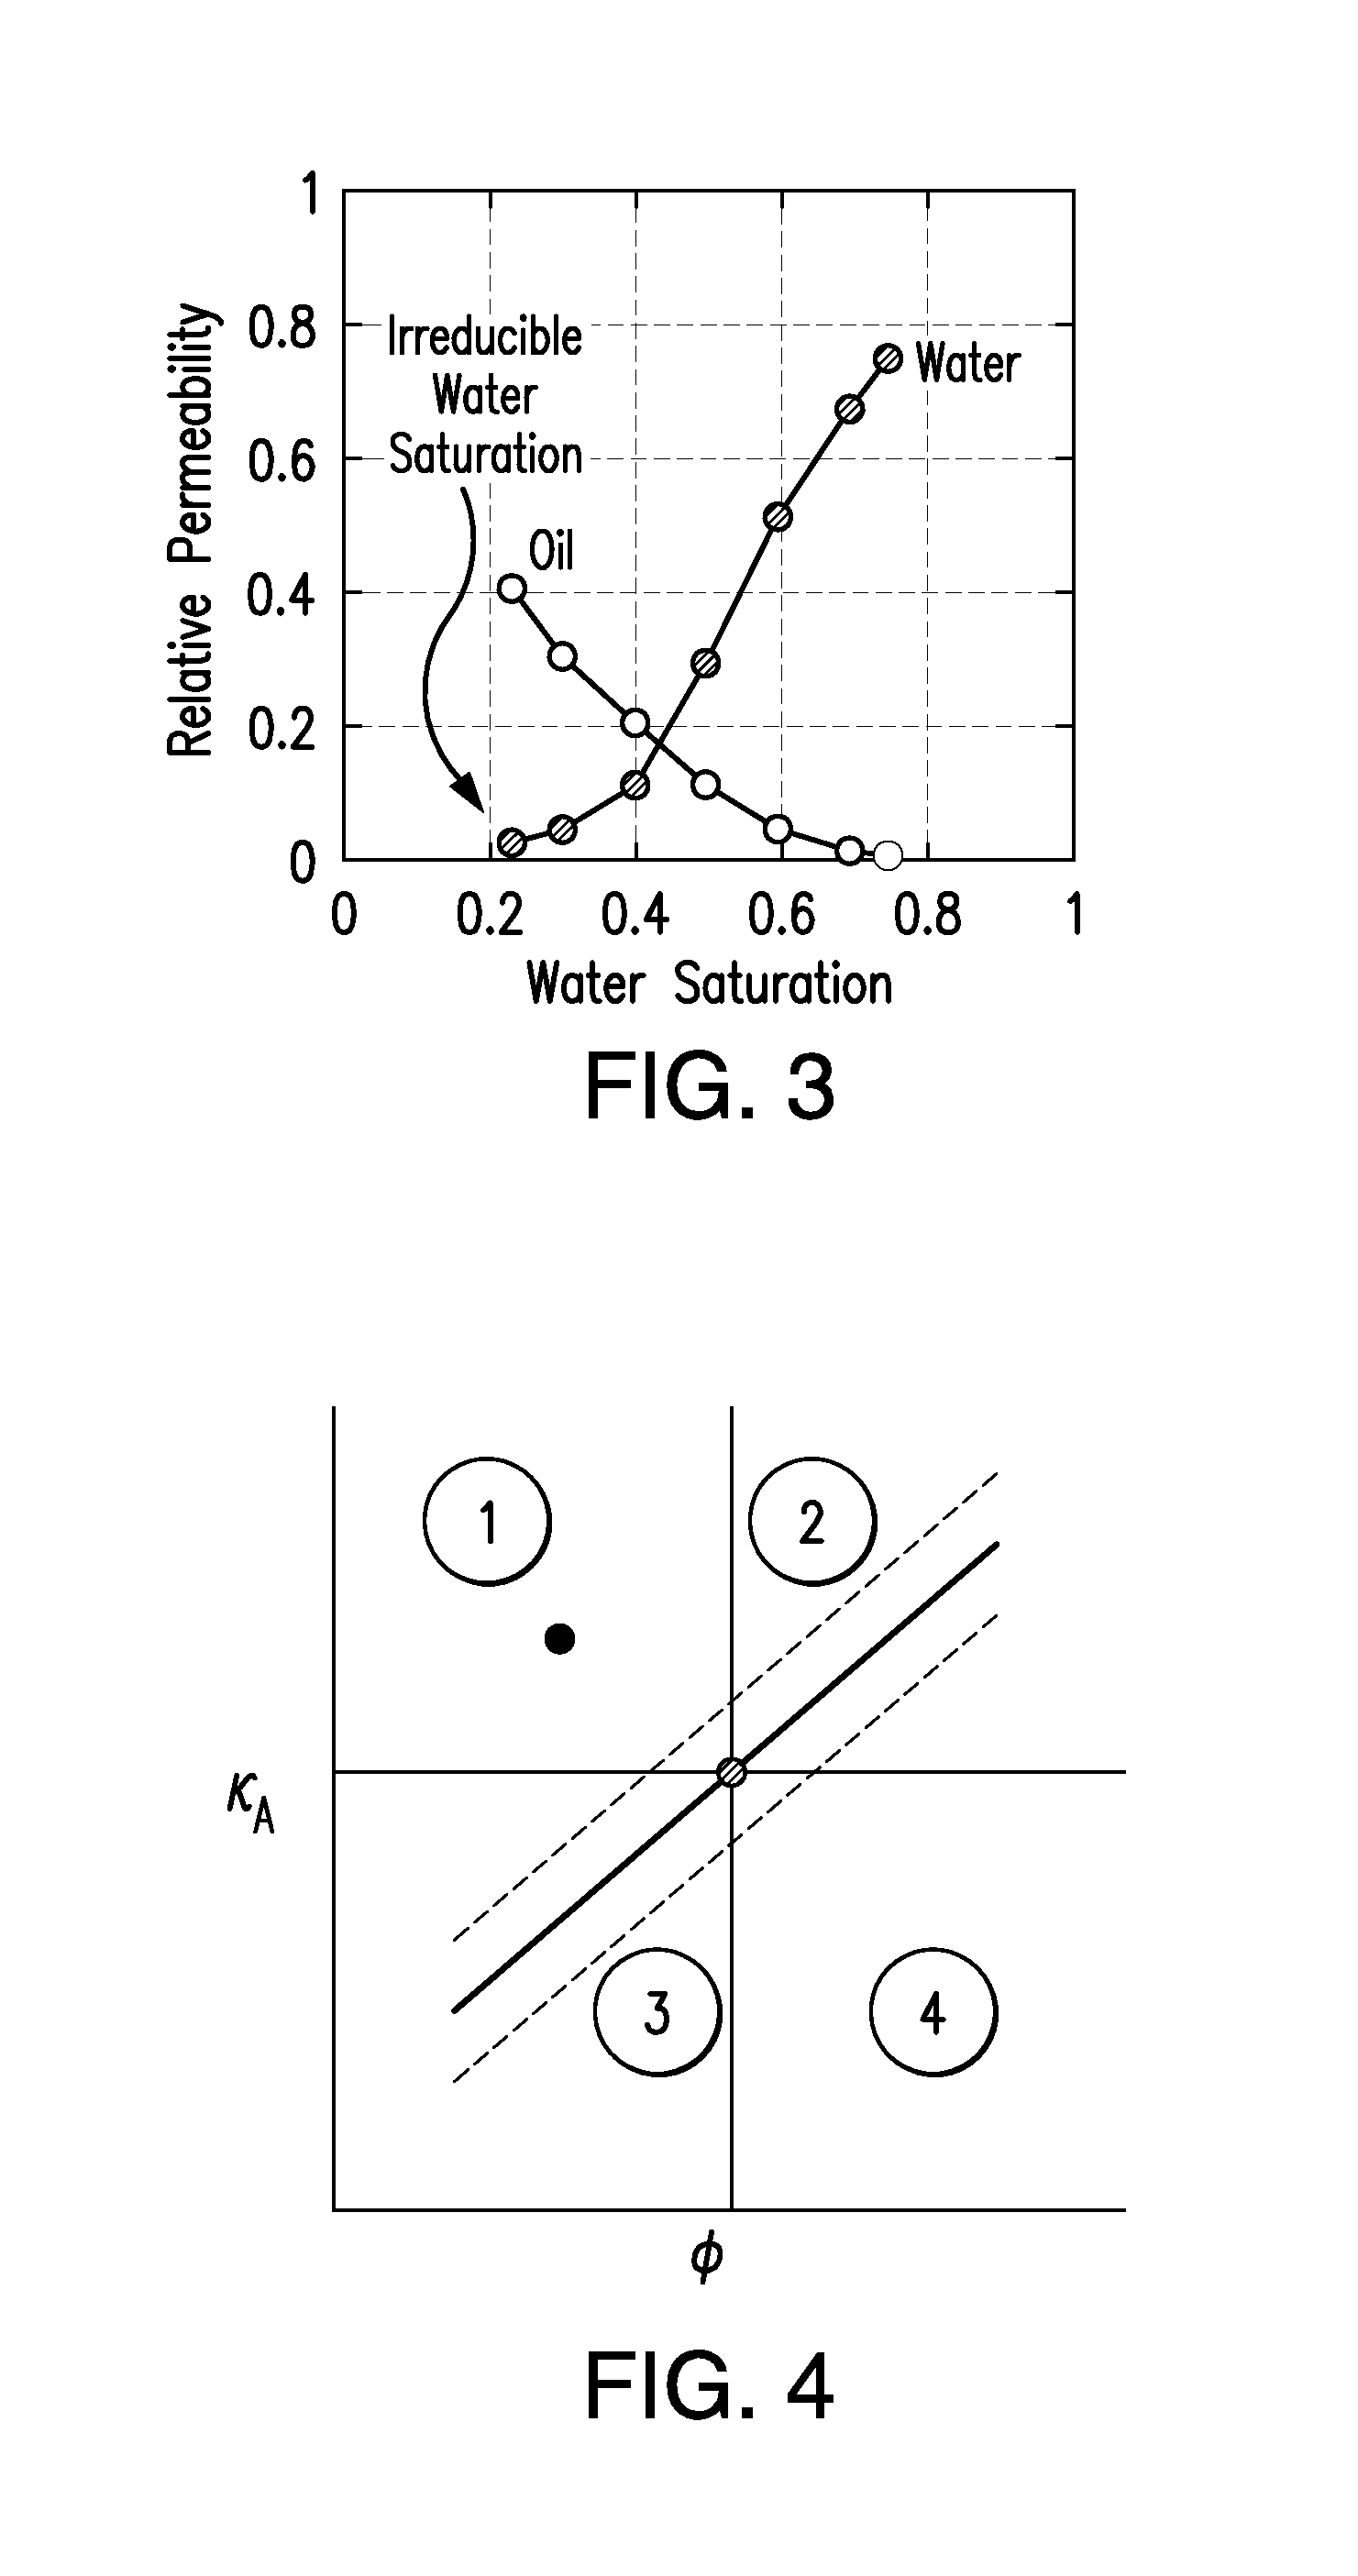
[0227]4. By sub-sampling the resulting digital volumes, establish rock physics relations (trends, transforms, or models) between velocity, porosity, and mineralogy; permeability, porosity, and mineralogy; electrical formation factor versus porosity and mineralogy; relative permeability and saturation. Theoretically substantiate and expand these models.

[0228]5. Select one or more of parameters measured in the well (e.g., the bulk density and / or elastic-wave velocity) or on the core (the bulk density and electronic number) and then, by...


PUM


Abstract

The present invention relates to a method and system for integrating logging tool data and digital rock physics to estimate rock formation properties. A rock sample from a logging tool such as a sidewall plug or large enough cutting can be extracted by the logging tool at approximately the same well bore location that the logging tool measures fluid properties. The rock samples thus obtained is scanned using a CT scanner, scanning electron microscope or other suitable scanning device. The resulting scanned rock image can be segmented and rock properties comprising porosity, absolute permeability, relative permeability, capillary pressure and other relevant rock properties are calculated. The resulting digital calculations are integrated with logging tool data and rock property estimates to improve the accuracy and timeliness of the logging tool data.

Description

[0001]This application claims the benefit under 35 U.S.C. §119(e) of prior U.S. Provisional Patent Application No. 61 / 484,254, filed May 10, 2011, which is incorporated in its entirety by reference herein.BACKGROUND OF THE INVENTION[0002]The present invention relates to methods and systems for integrating logging tool data and digital rock physics to estimate rock formation properties. More particularly, the present invention relates to estimating rock formation properties with integration of logging tool data obtained from a subsurface rock formation and digital rock physics using digital computer tomographic (CT) and / or scanning electron microscope (SEM) images of rock samples retrieved from the same interval of the formation.[0003]Exhaustive formation characterization from remote measurements that include seismic reflection profiling, well logging, and well testing requires a set of controlled laboratory experiments conducted on rock samples that represent the formation under exa...

Claims


Application Information

Patent Timeline
Patent Type & Authority Patents(United States)
IPC IPC(8): G01V5/10
CPCG01V5/101G01V5/107G01V5/104G01V5/04G01N23/046G01N2223/616G01N2223/419G01N23/2251G01N33/241
Inventor DVORKIN, JACKTONO, HENRIQUESISK, CARLMALONE, DAVID
Owner HALLIBURTON ENERGY SERVICES INC
Why Eureka
Try Eureka