Estimating the locations of power system events using PMU measurements

a power system and event location technology, applied in the field of power systems, can solve the problems of power operators being inundated and preventing them from recognizing critical grids, and achieve the effect of improving the estimation of event time, fast and scalable, and being reliabl

Active Publication Date: 2017-08-29
HITACHI LTD
View PDF18 Cites 7 Cited by
  • Summary
  • Abstract
  • Description
  • Claims
  • Application Information

AI Technical Summary

Benefits of technology

[0012]There is a need for a system and method to automatically detect “events” that are not caused by normal load and generation variations, so that operators can be alerted early on and can take remedy actions in time. Such events include transient phenomenon (usually lasting less than one second) introduced by line breaker operation, reclosing, and faults, as well as steady state changes (lasting on the order of seconds) from topology and power flow variations, which are often seen in grid operations but are seldom monitored. Such a system should be robust, fast, and scalable, to be able to handle hundreds of PMUs and detect events in close to real time.
[0013]Example implementations of the present disclosure involve systems and methods to monitor PMU data continuously for anomalies, estimate the time and location of the event underlying each cluster of anomalies occurring close together in time that affects three or more PMUs; and incorporate information about the power grid topology to improve the estimation of event time and location.

Problems solved by technology

The use of PMUs may cause power operators to be inundated by massive amounts of data, which prevents them from recognizing critical grid information and abnormal behaviors and responding in a timely manner.
Due to the lack of efficient online analysis methods, related art implementations of PMU data are primarily visualized for online monitoring and are rarely used for operational decision support.

Method used


Image

  • Estimating the locations of power system events using PMU measurements
  • Estimating the locations of power system events using PMU measurements
  • Estimating the locations of power system events using PMU measurements

Examples


Embodiment Construction

[0027]The following detailed description provides further details of the figures and example implementations of the present application. Reference numerals and descriptions of redundant elements between figures are omitted for clarity. Terms used throughout the description are provided as examples and are not intended to be limiting. For example, the use of the term “automatic” may involve fully automatic or semi-automatic implementations involving user or administrator control over certain aspects of the implementation, depending on the desired implementation of one of ordinary skill in the art practicing implementations of the present application.

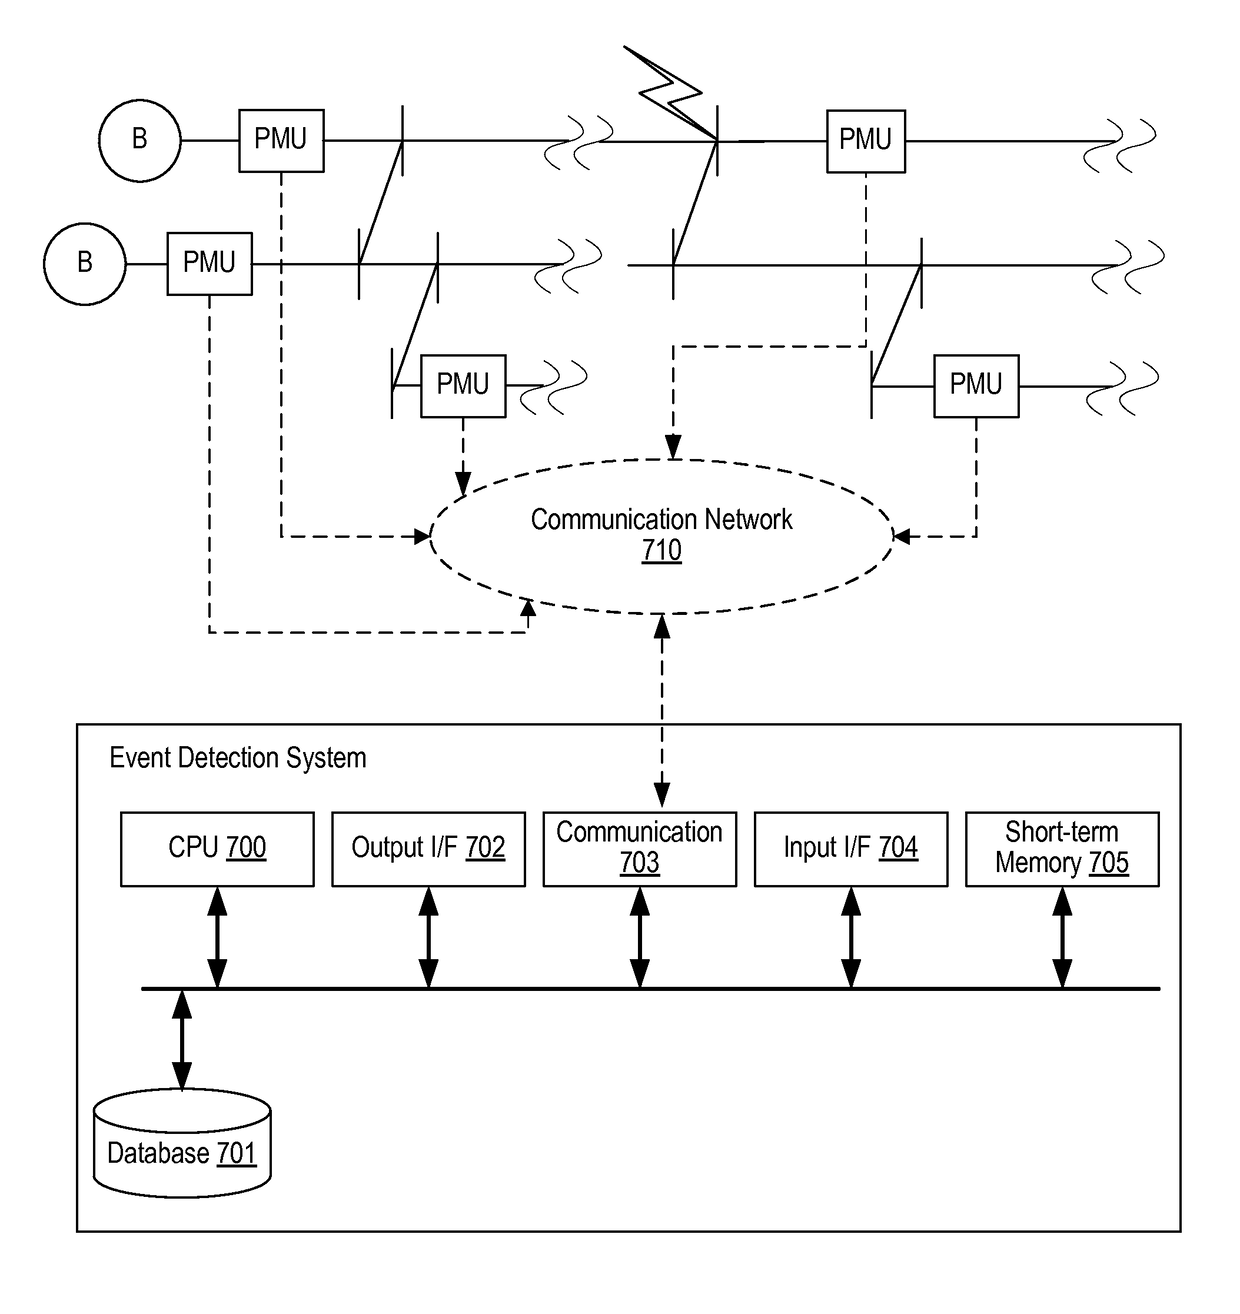
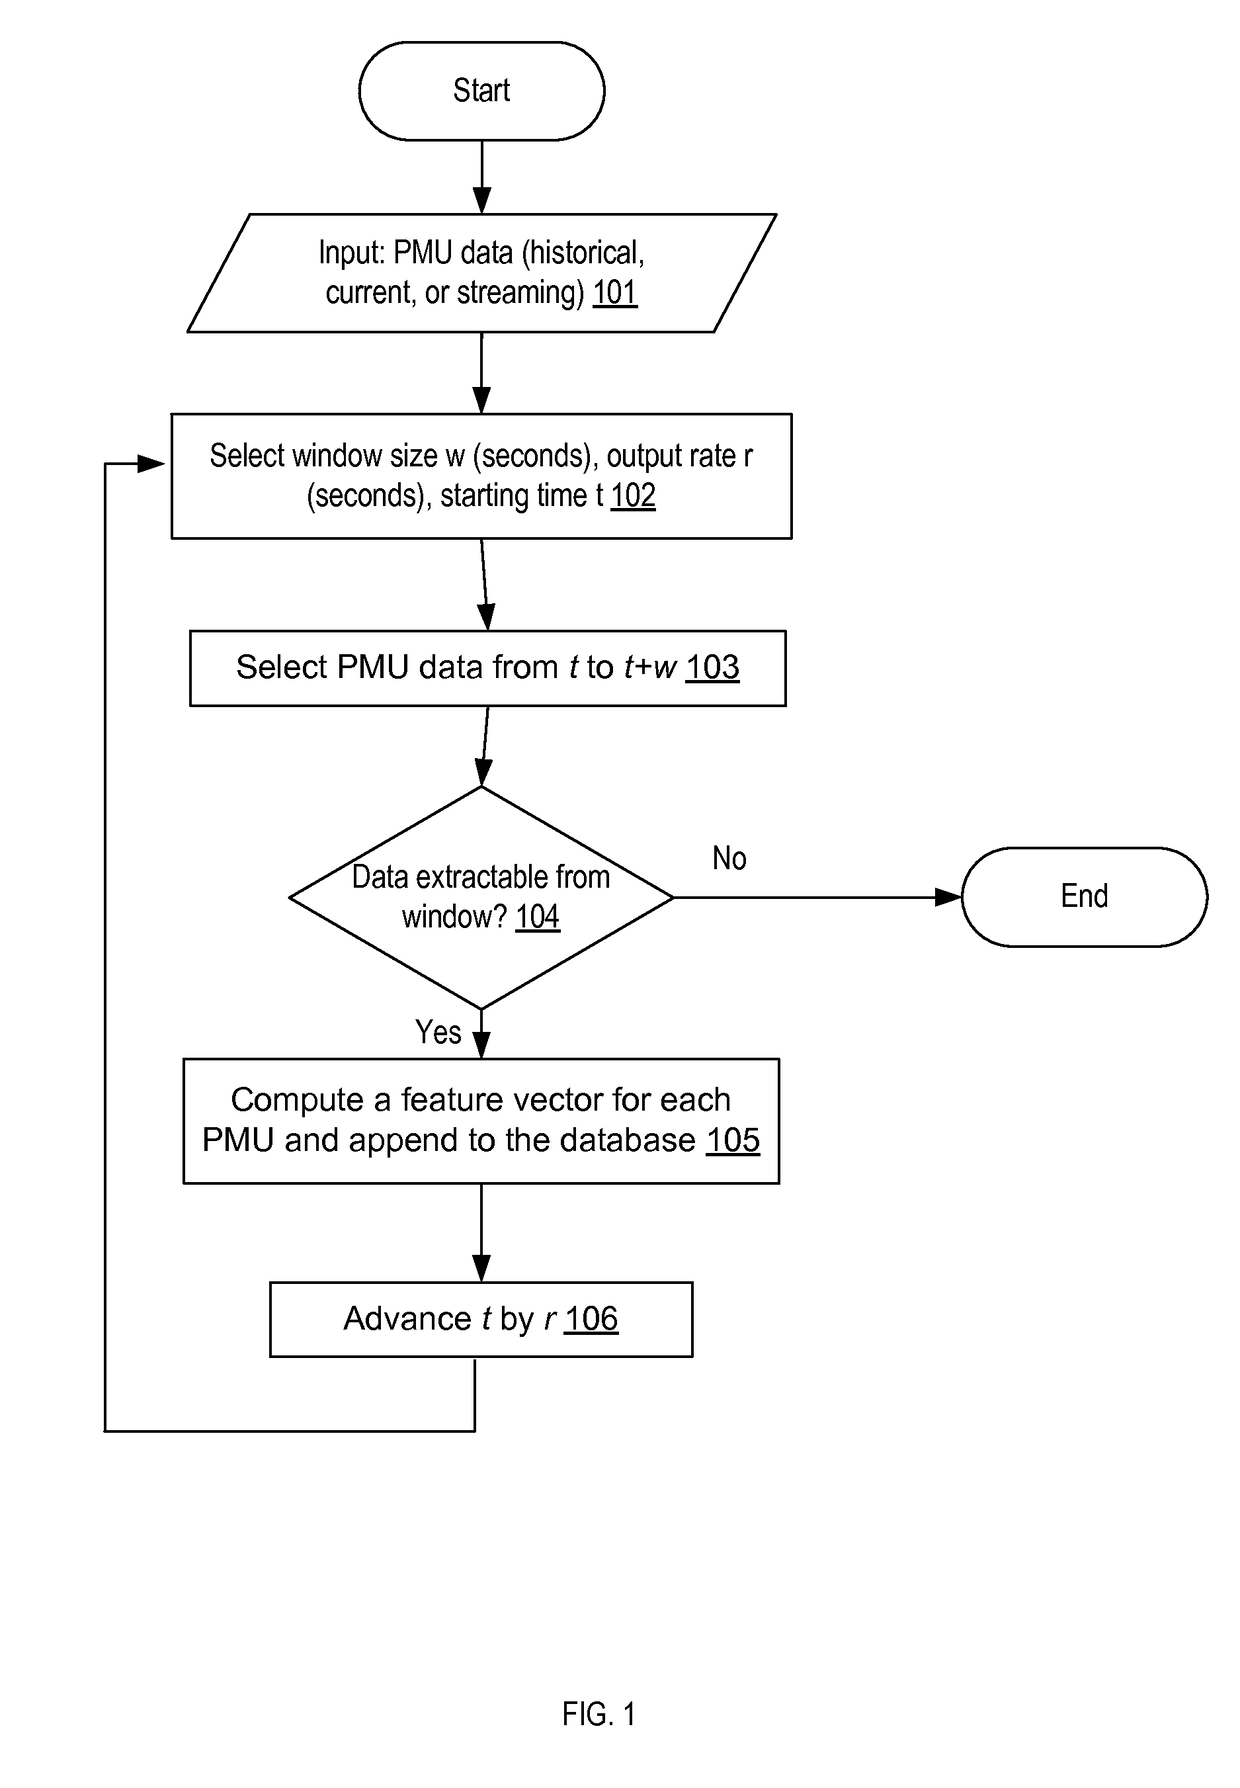
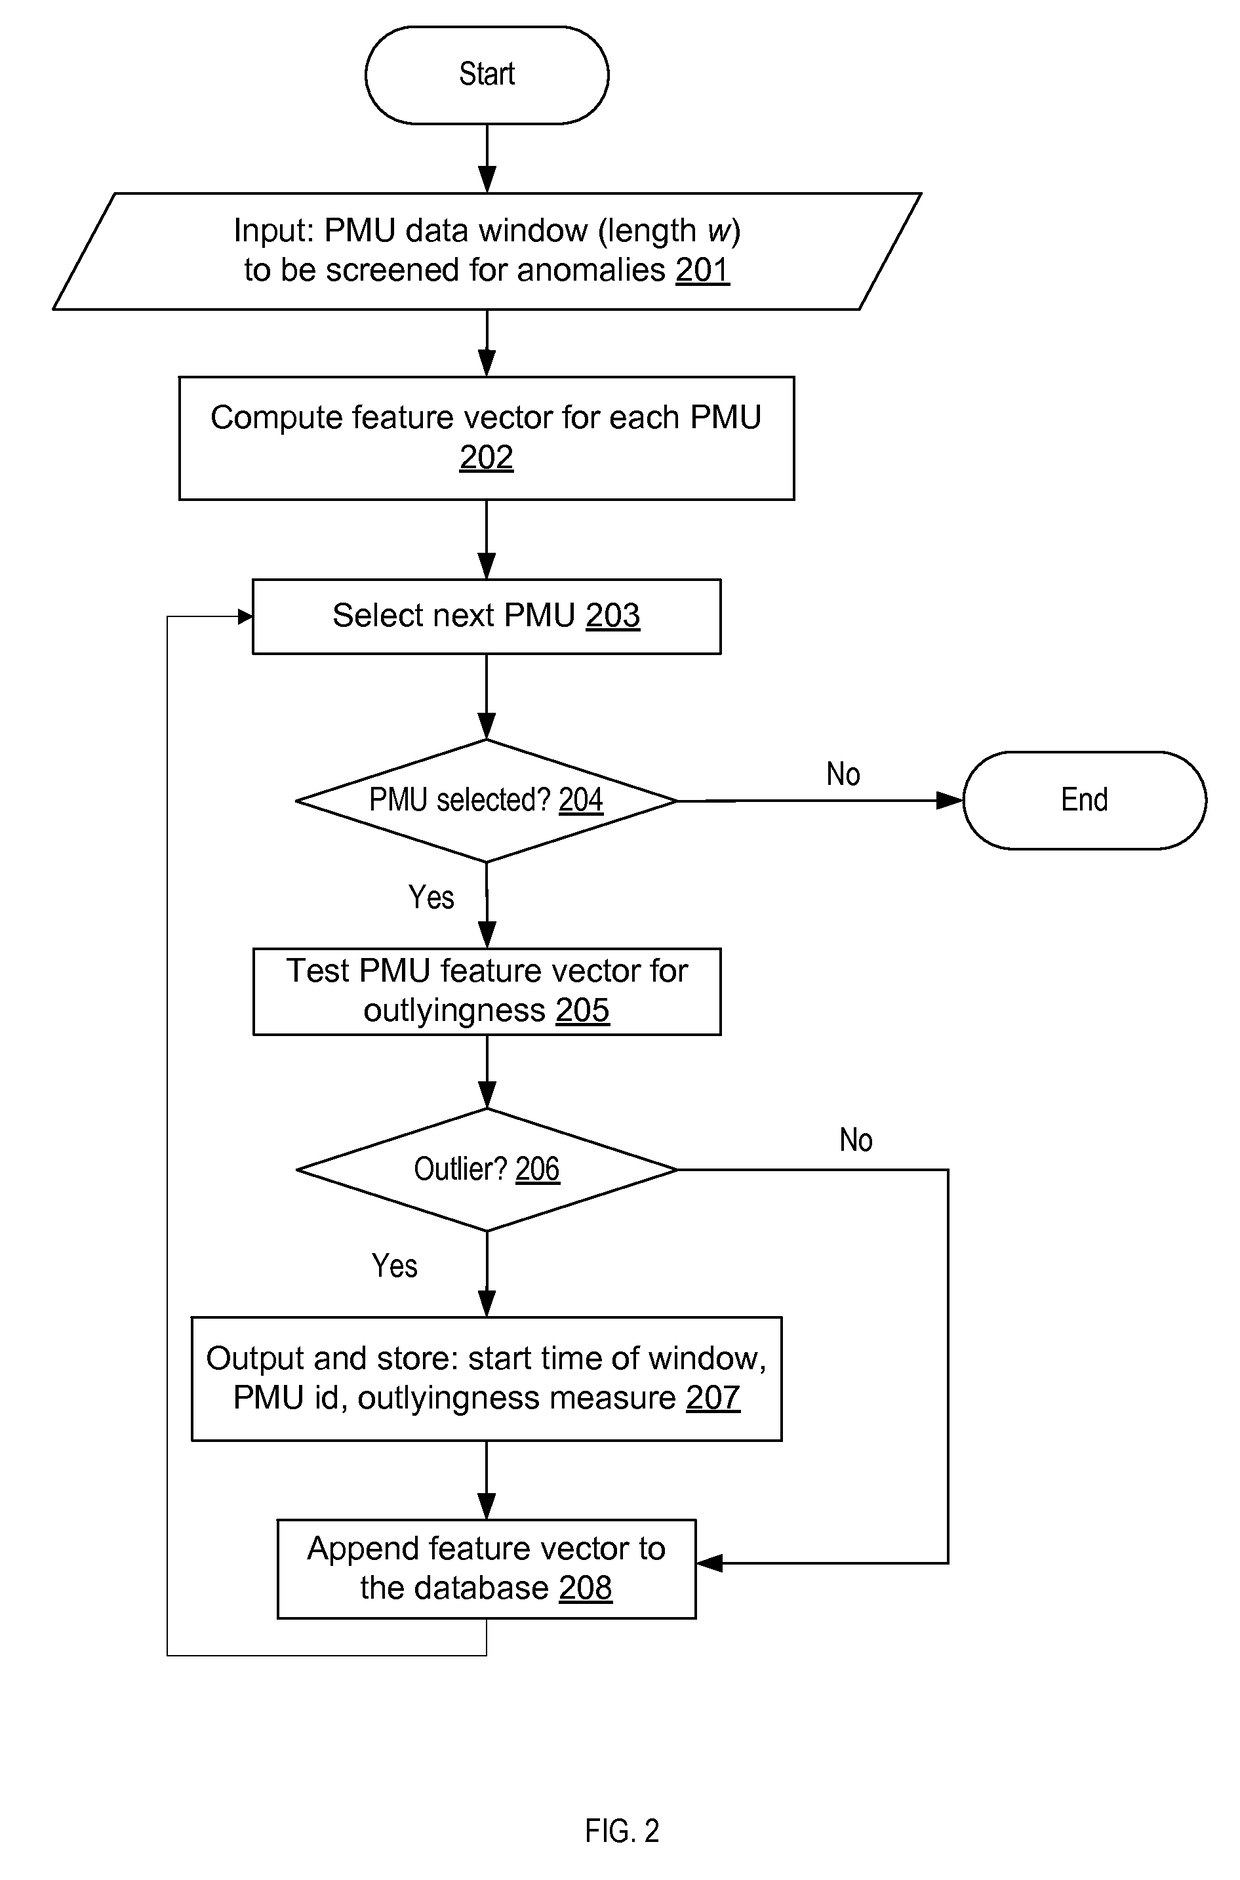
[0028]Example implementations involve a method to detect anomalies in the PMU data, which can be implemented as an anomaly detection module. The anomalies may arise from various power system events, such as transient phenomena (usually lasting less than one second) introduced by line breaker operation, reclosing, and faults, as well as st...


PUM


Abstract

Example implementations described herein are directed to detection of anomalous events and locations on the transmission power system using phasor management unit (PMU) data, which provides information to grid operators for online decision support. From the high-resolution time synchronized PMU data, the transient abnormal events can be monitored and locations can be disclosed to operators for remedy actions. Utilization of PMU information for such decision support compliments operation practices relying on supervisory control and data acquisition (SCADA) measurements at much lower data resolution. Accurate identification of event locations can further advise grid operators the root cause of disturbances and illuminate possible cascading failures. Implementations of the proposed technology may improve the resilience and reliability of the transmission power systems.

Description

BACKGROUND[0001]Field[0002]The present disclosure relates to power systems, and more specifically, to management of power system events through phasor measurement units (PMUs).[0003]Related Art[0004]In the related art implementations, the location determination of power system disturbances has been researched. In one example from the related art, frequency responses of the system have been considered. In an example of a related art implementation, there is a system for detecting and locating a disturbance event within a power grid includes a series of frequency disturbance recorders (FDRs) taking measurements in the power grid at dispersed points of the power grid. In related art implementations, the information management system is configured to receive data from the series of FDRs and analyze the received data and a communications network interconnecting the series of FDRs and the information management system.[0005]Another example related art implementation includes a system that...

Claims


Application Information

Patent Timeline
Patent Type & Authority Patents(United States)
IPC IPC(8): G01R31/08G01P7/00G01P3/42G01R23/02G01P3/00G01P3/50G01R31/11
CPCG01R31/086G01R23/02G01R31/08G01P3/00G01P3/50G01P7/00G01R31/11G01R19/2513G01R29/18G01R31/085G01R31/088Y02E40/70Y02E60/00Y04S10/00Y04S10/22
Inventor WANG, ALEXTANG, HSIU-KHUERNYANG, BOYAMAZAKI, JUN
Owner HITACHI LTD
Why Eureka
Try Eureka