

Liver subsection method based on CT image and system thereof
A liver segmentation and CT image technology, applied in the field of liver segmentation methods and systems, can solve the problems of inability to perform interactive operations, inability to quickly and easily correct classification results, segmentation errors, etc., and achieve convenient classification, easy modification, and improvement. effect of effect
- Summary
- Abstract
- Description
- Claims
- Application Information
AI Technical Summary
Problems solved by technology
Method used
Image

Examples
Embodiment Construction
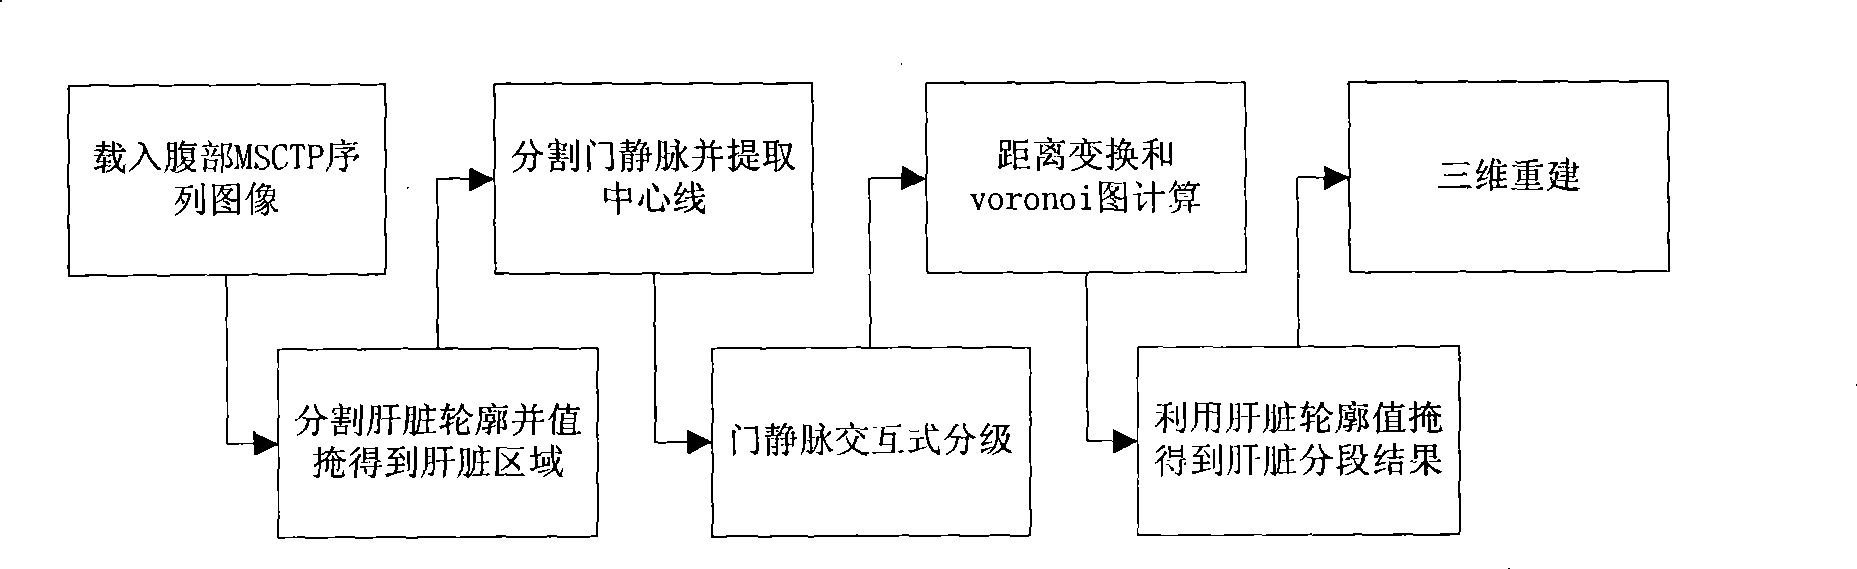
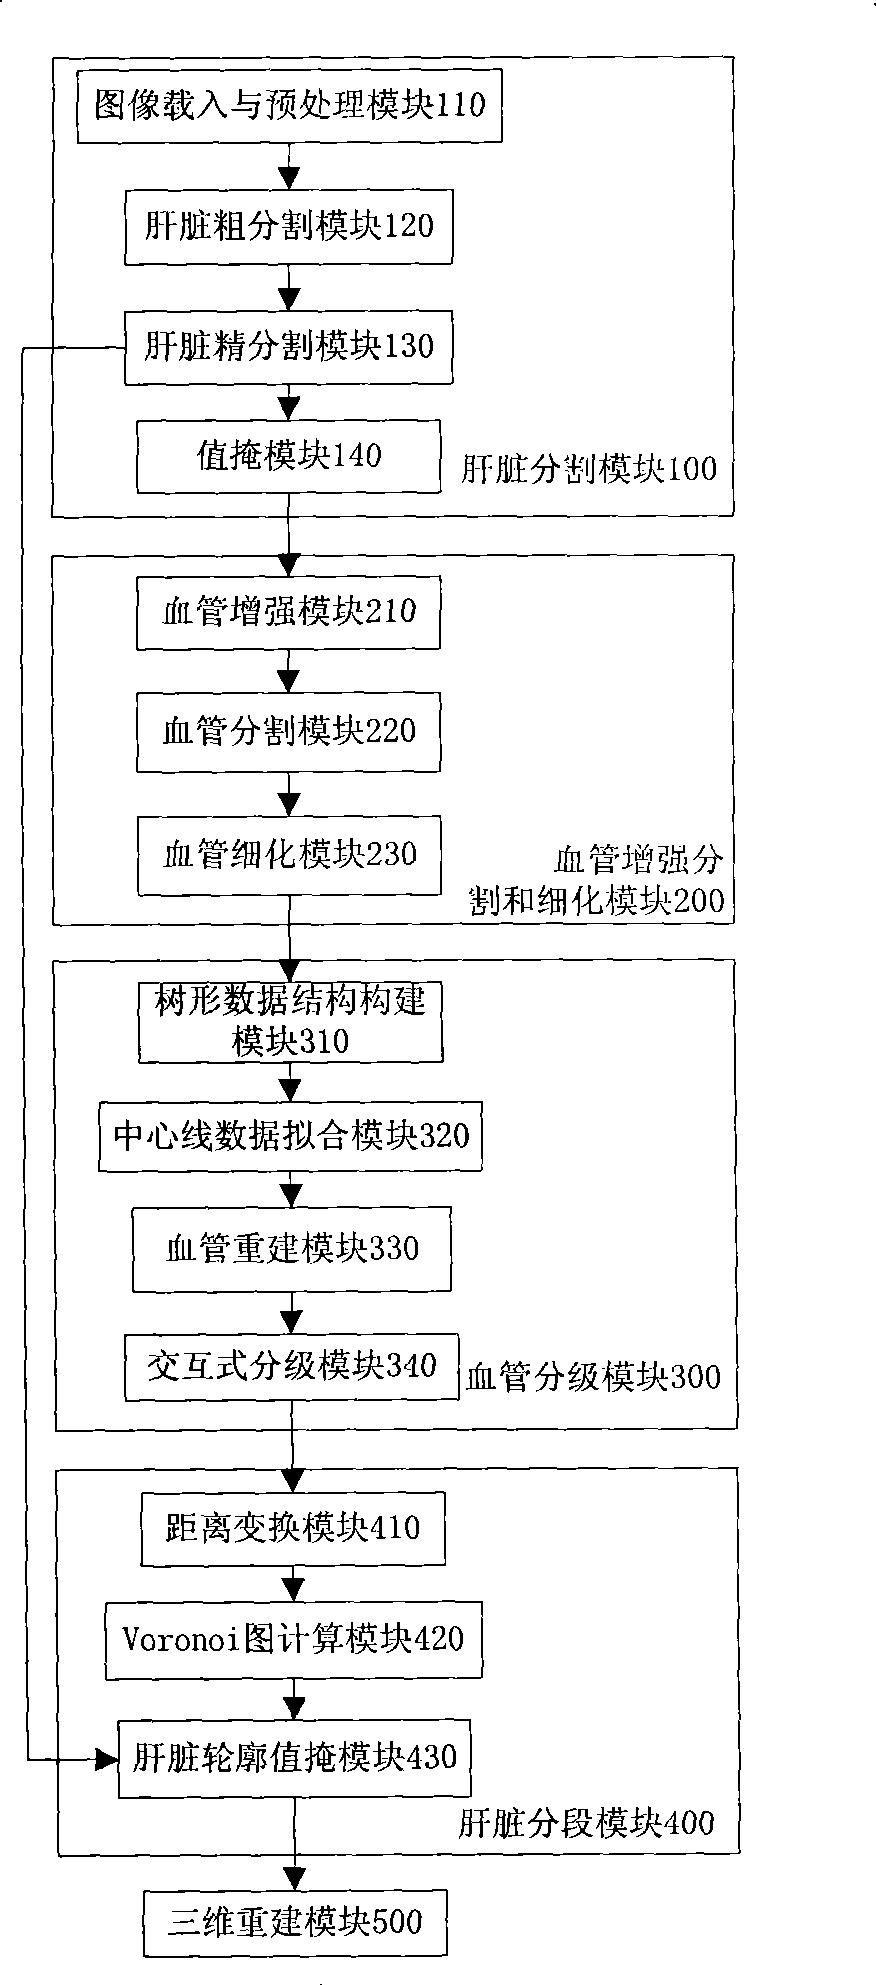
[0038] The invention is a complete liver segmentation method for MSCTP sequence images. The liver segmentation of the present invention is divided according to the areas to which different branches of the portal vein belong, and the liver segmentation mainly includes five parts: liver segmentation, blood vessel segmentation and thinning, blood vessel classification, liver segmentation and three-dimensional reconstruction.
[0039] The technical solutions of the present invention will be further described in detail below in conjunction with the accompanying drawings and examples.
[0040] Such as figure 1 Shown, the inventive method comprises the following steps:
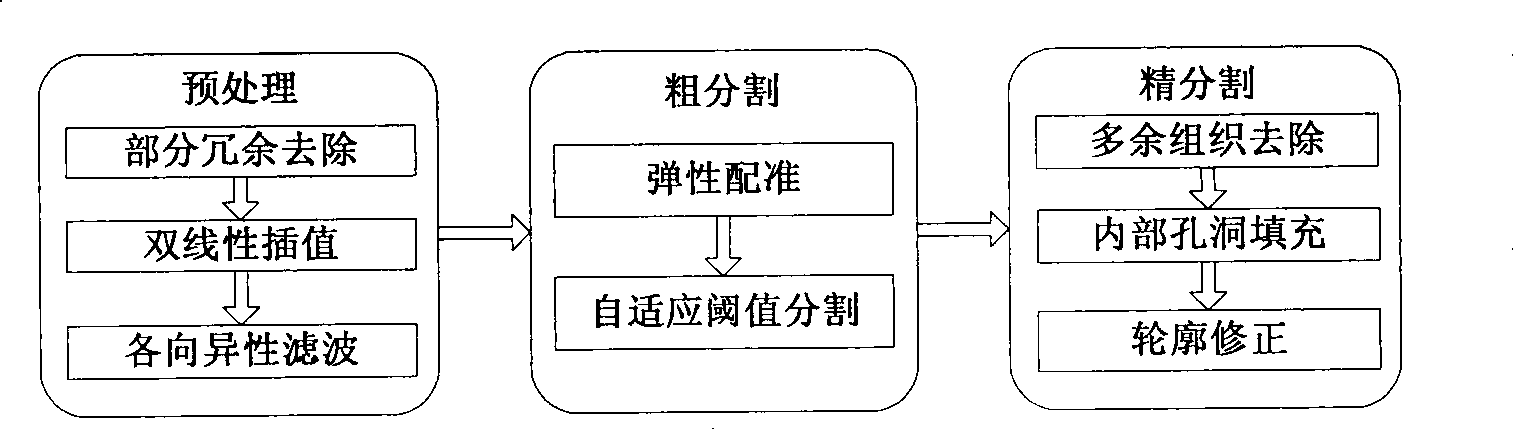
[0041] (1) Load the portal venous phase and arterial phase sequence images of abdominal MSCTP, and automatically segment the liver. The flow chart is as follows image 3 As shown, the specific steps are as follows:
[0042] (1.1) Preprocessing. The sequence images of the portal venous phase and the arterial phase...
PUM
 Abstract
Description
Claims
Application Information