Production method of television line diagram for testing photoelectronic imaging system resolution power

A photoelectric imaging and production method technology, which is applied in the direction of testing optical performance, optical instrument testing, machine/structural component testing, etc., and can solve the problems of high cost, unsatisfactory, and inability to meet the needs of higher and higher pixels for special charts, etc. , to achieve the effect of good versatility, avoiding Chart usage and distribution errors, and low cost

Active Publication Date: 2009-06-24
SHANGHAI LAIMU ELECTRONICS
View PDF0 Cites 9 Cited by
  • Summary
  • Abstract
  • Description
  • Claims
  • Application Information

AI Technical Summary

Problems solved by technology

[0004] (2) Cannot meet the needs of focusing
For a chart with a relatively specified size, if the focus distance is met, it cannot be satisfied to just see all the contents of the Chart; just to see all the contents of the Chart cannot meet the focus distance;
[0005] (3) The cost of dedicated Chart is high;
[0006] (4) It cannot accurately represent the imaging situation of the same field of view
In the original Chart, the horizontal and vertical lines in the same part are too far apart, which cannot clearly indicate the imaging conditions of the meridian image field and arc aberration field in the same area;
[0007] (5) It cannot meet the needs of higher and higher pixels

Method used


Image

  • Production method of television line diagram for testing photoelectronic imaging system resolution power
  • Production method of television line diagram for testing photoelectronic imaging system resolution power
  • Production method of television line diagram for testing photoelectronic imaging system resolution power

Examples


Embodiment 1

[0056] Parameters related to chart design:

[0057] CMOS Sensor parameters: pixel array: 640 x 480; pixel size: 3.0um

[0058] Lens parameters: F / No.=2.8; EFL=1.96mm

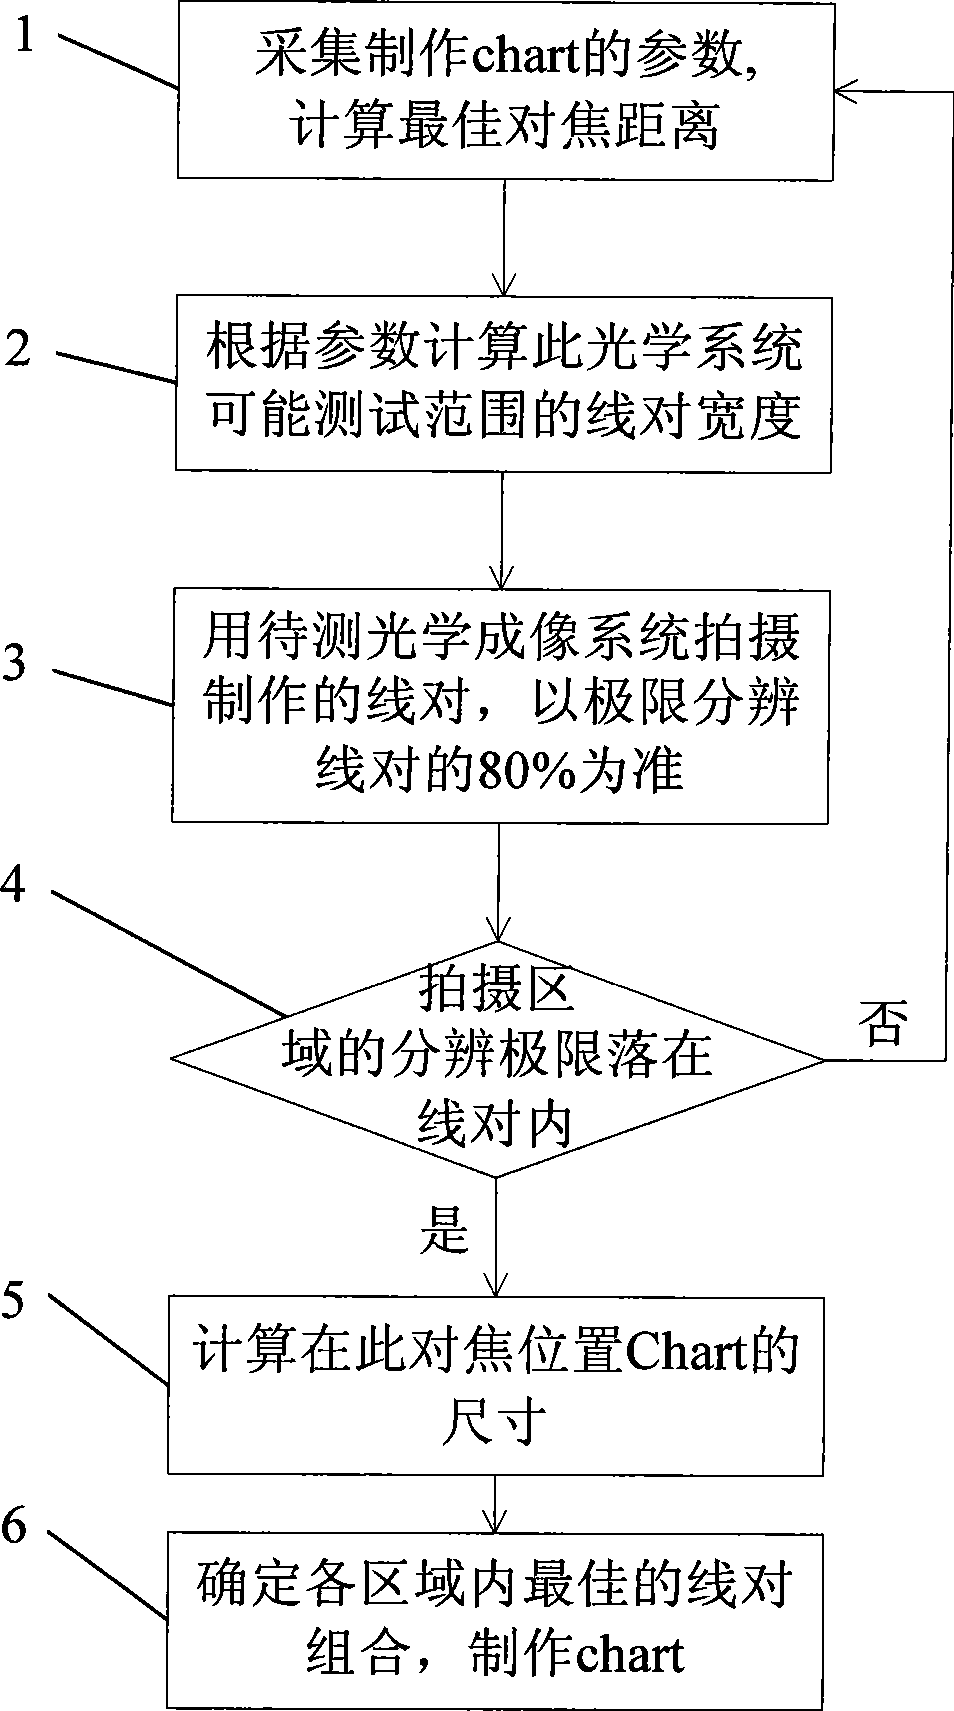
[0059] For the optimal imaging distance and line width of all levels of this photoelectric imaging system:

[0060] Best focusing distance: 30cm;

[0061] Line width:

[0062] 400TVL: 0.5474mm

[0063] 350TVL: 0.6256mm

[0064] 300TVL: 0.7299mm

[0065] 250TVL: 0.8759mm

[0066] 200TVL: 1.095mm

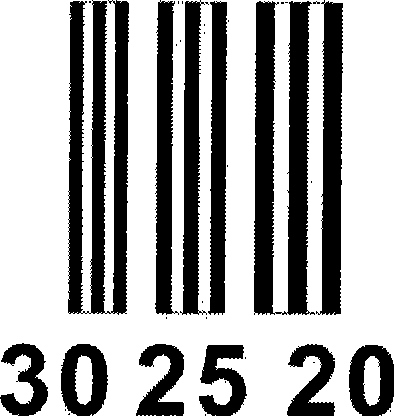
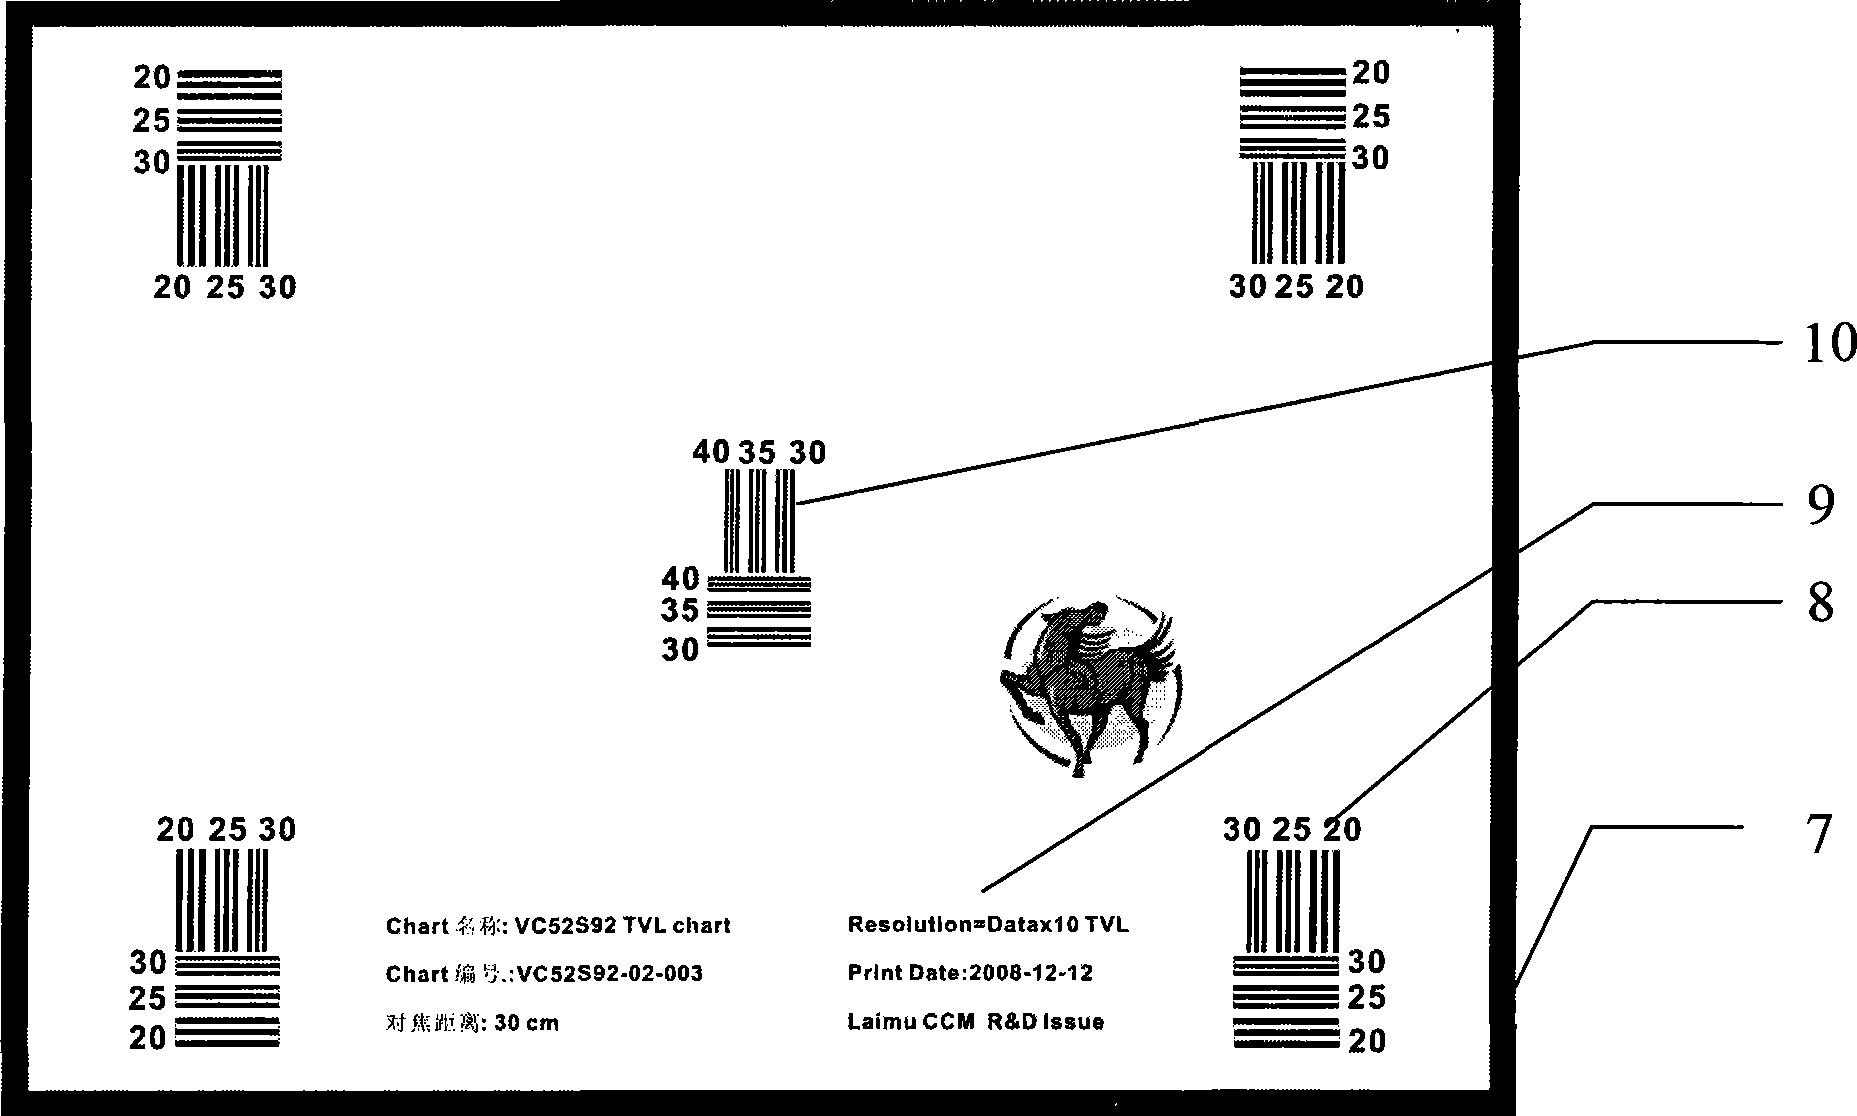
[0067] Take pictures of the pair clusters to determine if the pairs and the pair clusters are arranged properly:

[0068] Photographs taken of line-pair clusters in the central area:

[0069] The central 400TVL line pair cannot be clearly distinguished, the 350TVL line pair can be distinguished, and the 300TVL line pair can be clearly distinguished. It shows that the line pair selection is reasonable and the line pair cluster arrangement is correct;

[0070] 0.7 field of view area line-to-cluster shooting pho...


PUM


Abstract

The invention relates to a method for manufacturing a television line chart for testing the resolving power of a photoelectronic imaging system. The manufacturing method comprises the following steps: gathering parameters for manufacturing the chart, and calculating the optimal focusing distance; calculating the line pair length of the possible measuring range of the optical system according to the parameters; filming the manufactured line pair with an optical imaging system to be tested, and taking 80% of the ultimate resolution line pair as the basis; testing whether the resolving limit of the filming area falls in the line pair, and if yes, measuring the size of the chart in the focusing position; and determining the optimal line pair combination in all the areas for manufacturing the chart. Compared with the prior art, the invention has the following advantages: the resolving power of the optical system to be tested can be subjected to a quantitative test; the universality is good; the problem that the focusing distance is limited by the size of the chart is solved; the cost is low; the imaging conditions of the testing areas can be reflected more clearly; the invention can not be limited by the number of pixels or the definition; and with the Chart information, the invention is more suitable for mass production.

Description

technical field [0001] The invention relates to a test and performance detection method of a photoelectric imaging device, in particular to a method for making a TVL chart for testing the resolution of a photoelectric imaging system. Background technique [0002] In today's era, photoelectric imaging instruments such as digital cameras, mobile phone cameras, industrial and medical endoscopes have been widely used in people's lives. The testing and performance testing of photoelectric imaging instruments has become very important in the design and production. The present invention primarily arose in response to this need. The existing test charts are mainly made for 36mm film and 50mm traditional standard lens. For the current dazzling array of optoelectronic imaging systems, some places can be tested qualitatively, but not quantitatively. The existing international charts for detecting resolution include: EIA 1956 resolution chart, ISO12233 Resolution chart, IEEE resoluti...

Claims


Application Information

Patent Timeline
Patent Type & Authority Applications(China)
IPC IPC(8): G01M11/00G01M11/02
Inventor 朱新爱朱峰
Owner SHANGHAI LAIMU ELECTRONICS
Why Eureka
Try Eureka