Spectroscopic analysis methods
A technology of spectrum and spectral value, applied in the field of spectroscopic instruments, can solve problems that are difficult to explain, unstable main components, etc.
- Summary
- Abstract
- Description
- Claims
- Application Information
AI Technical Summary
Problems solved by technology
Method used
Image
Examples
Embodiment I
[0045] Example I: Simulated mixture spectra
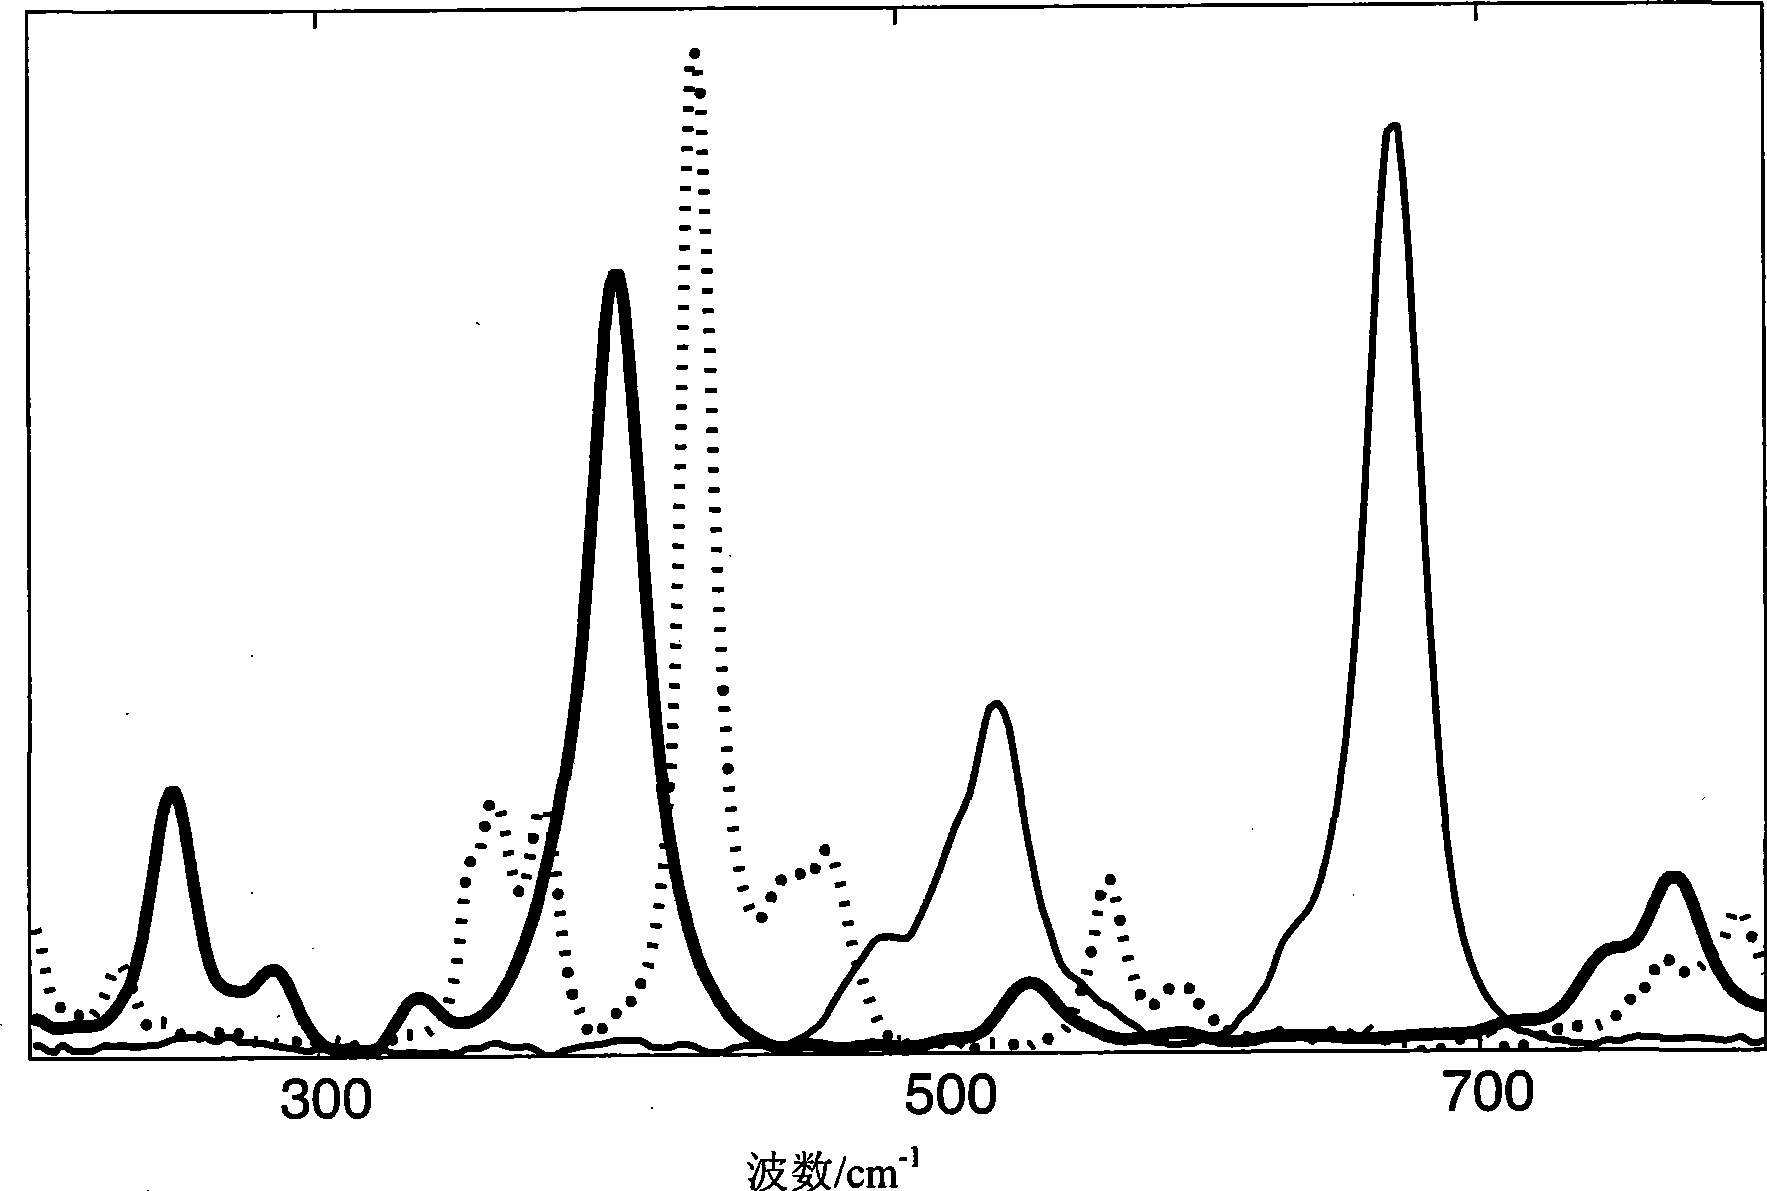
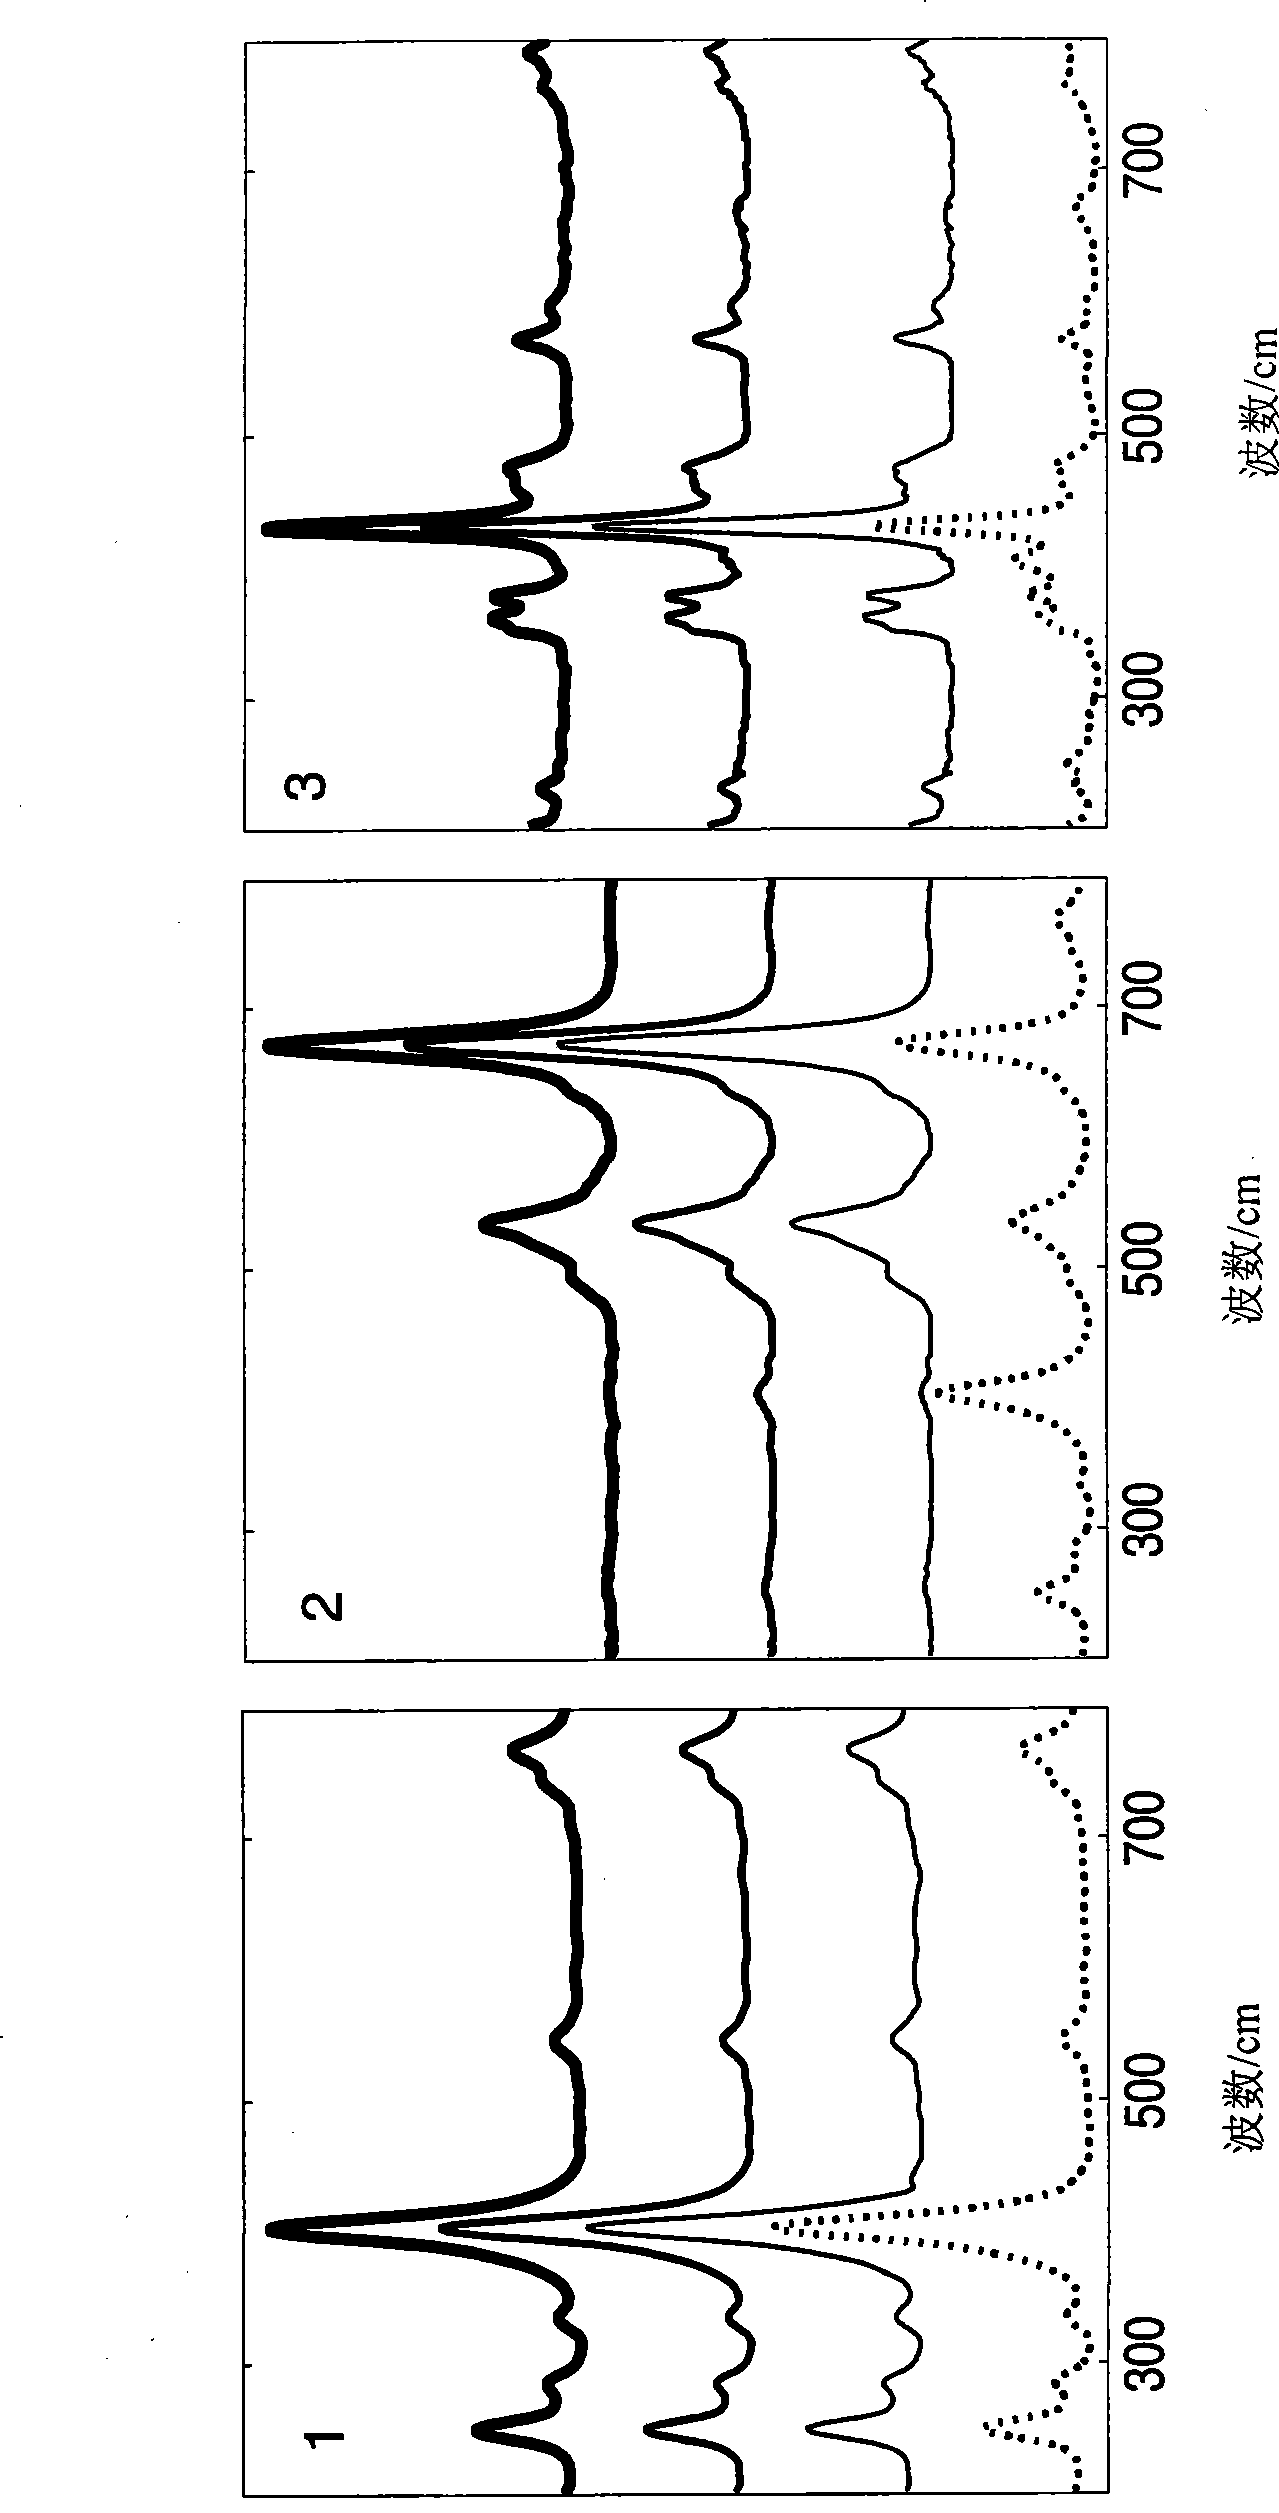
[0046] Pure Raman spectra of three pigments added in different ratios ( figure 2 ) to form a matrix of 2500 mixed spectra. The average, minimum and maximum ratios for each pigment spectrum are given in Table I. Spectra 1 and 2 are present in the entire dataset, while Spectrum 3 is only present in 100 spectra to simulate minor components. Random noise with Poissonian statistics is added to the data set to simulate disturbances caused by noise. The spectra used to form the data set were normalized by subtracting the minimum value (minimum value subtraction) and dividing by their intensity sum. This removes the intensity uncertainty from the dataset and facilitates direct comparison with the ALS method.
Embodiment II
[0047] Example II: Drug powder
[0048] The analyzed sample was a powdered mixture containing 1% active pharmaceutical ingredient (API) and 99% excipients including cellulose, lactose and dicalcium phosphate. The surface of the sample is leveled and point-focused spectra are collected from the surface. The map area is 600 μm x 66 μm with a 6 μm step size, giving 1212 collected spectra.
Embodiment III
[0049] Embodiment III: ranitidine tablet
[0050] A commercially available tablet containing 75 mg of ranitidine as API was analyzed. API accounts for approximately 50% of the total tablet mass. Excipients present at the core are microcrystalline cellulose and magnesium stearate. Use a scalpel to cut the tablet horizontally. Line focus maps were collected from an area of 1.68 mm x 1.95 mm. With a step size of 6 μm in x and an intrinsic step size of 5.81 μm in y, this gave 94000 collected spectra.
[0051] theory
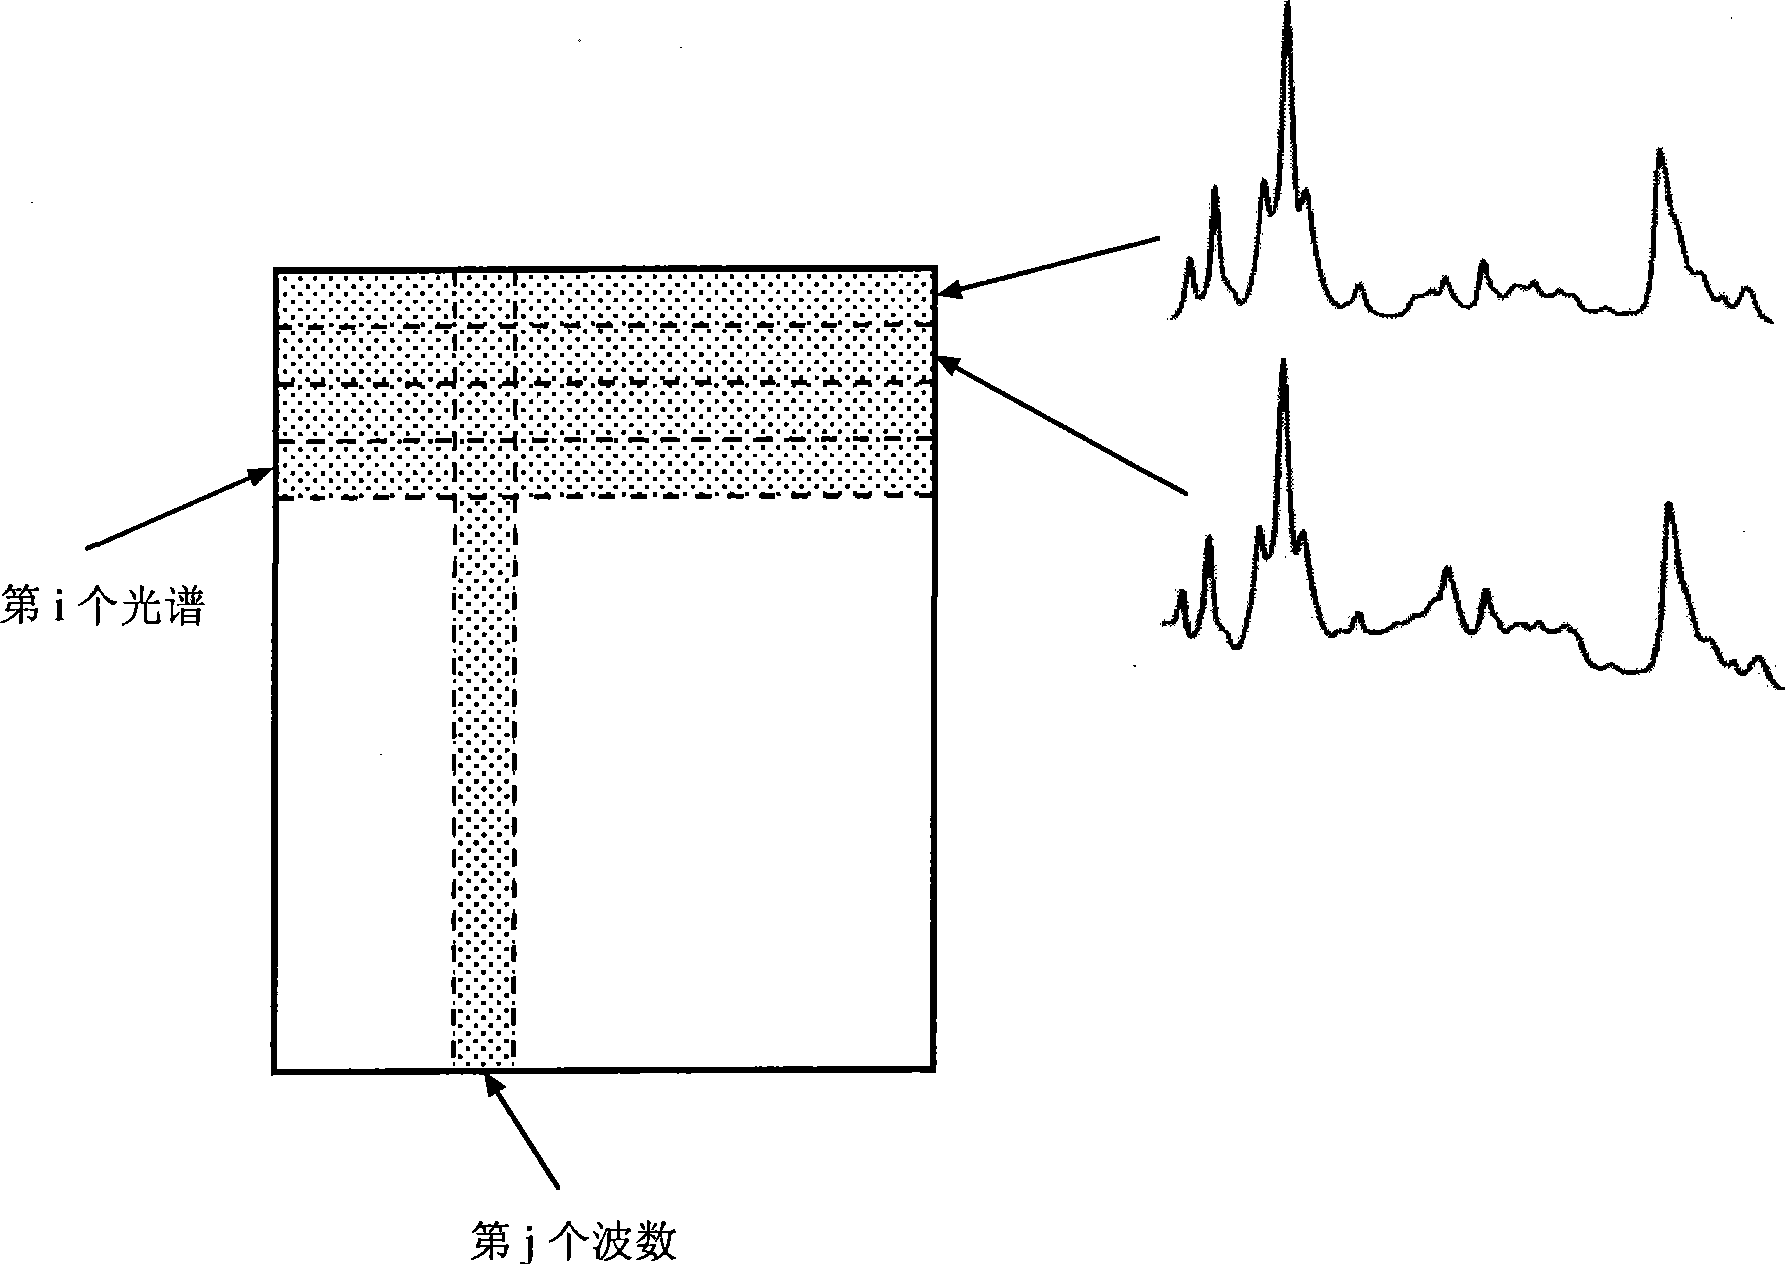
[0052] For chemometric analysis the hyperspectral image cube expands into a matrix X, so each collected spectrum occupies a row of the data matrix ( figure 1 ). The matrix has dimension I x J, where I is the total number of spectra from the data set and J is the number of variables which are the frequencies at which the intensities were collected. The purpose of curve analysis is to resolve this matrix into physical submatrices C and S:
[0053] X=C·S T +E...
PUM
 Abstract
Description
Claims
Application Information
 - R&D
- Intellectual Property
- Life Sciences
- Materials
- Tech Scout
- Unparalleled Data Quality
- Higher Quality Content
- 60% Fewer Hallucinations
Browse by: Latest US Patents, China's latest patents, Technical Efficacy Thesaurus, Application Domain, Technology Topic, Popular Technical Reports.
© 2025 PatSnap. All rights reserved.Legal|Privacy policy|Modern Slavery Act Transparency Statement|Sitemap|About US| Contact US: help@patsnap.com


