Visual analyzing and predicting method based on a virtual geological model

A geological model and prediction method technology, applied in the fields of exploration geology and computer technology, can solve problems such as slow response speed, inability to skillfully use the geological simulation visualization system, and difficulties for geological workers to master, so as to achieve significant economic and social benefits and reduce blindness sex, risk reduction effect

Inactive Publication Date: 2009-08-26
BEIJING INSTITUTE OF PETROCHEMICAL TECHNOLOGY +1
View PDF0 Cites 74 Cited by
  • Summary
  • Abstract
  • Description
  • Claims
  • Application Information

AI Technical Summary

Problems solved by technology

Marcus (2001) designed a visual spatial analysis tool, but it can only analyze and query the simple space-time and structural relationships between geological objects in the 3D model, and there are still many researches to be carried out and continued
[0006] 2) The design of interactive analysis and prediction operation methods in the virtual scene is complicated, and it is difficult for geologists to master
At present, geoscience simulation systems developed at home and abroad, such as GOCAD (2007) by the Mallet development team and geological modeling system by Qu Honggang of Peking University (2008), generally provide a complex interactive operating environment, and only those who have undergone

Method used


Image

  • Visual analyzing and predicting method based on a virtual geological model
  • Visual analyzing and predicting method based on a virtual geological model
  • Visual analyzing and predicting method based on a virtual geological model

Examples


Embodiment 1

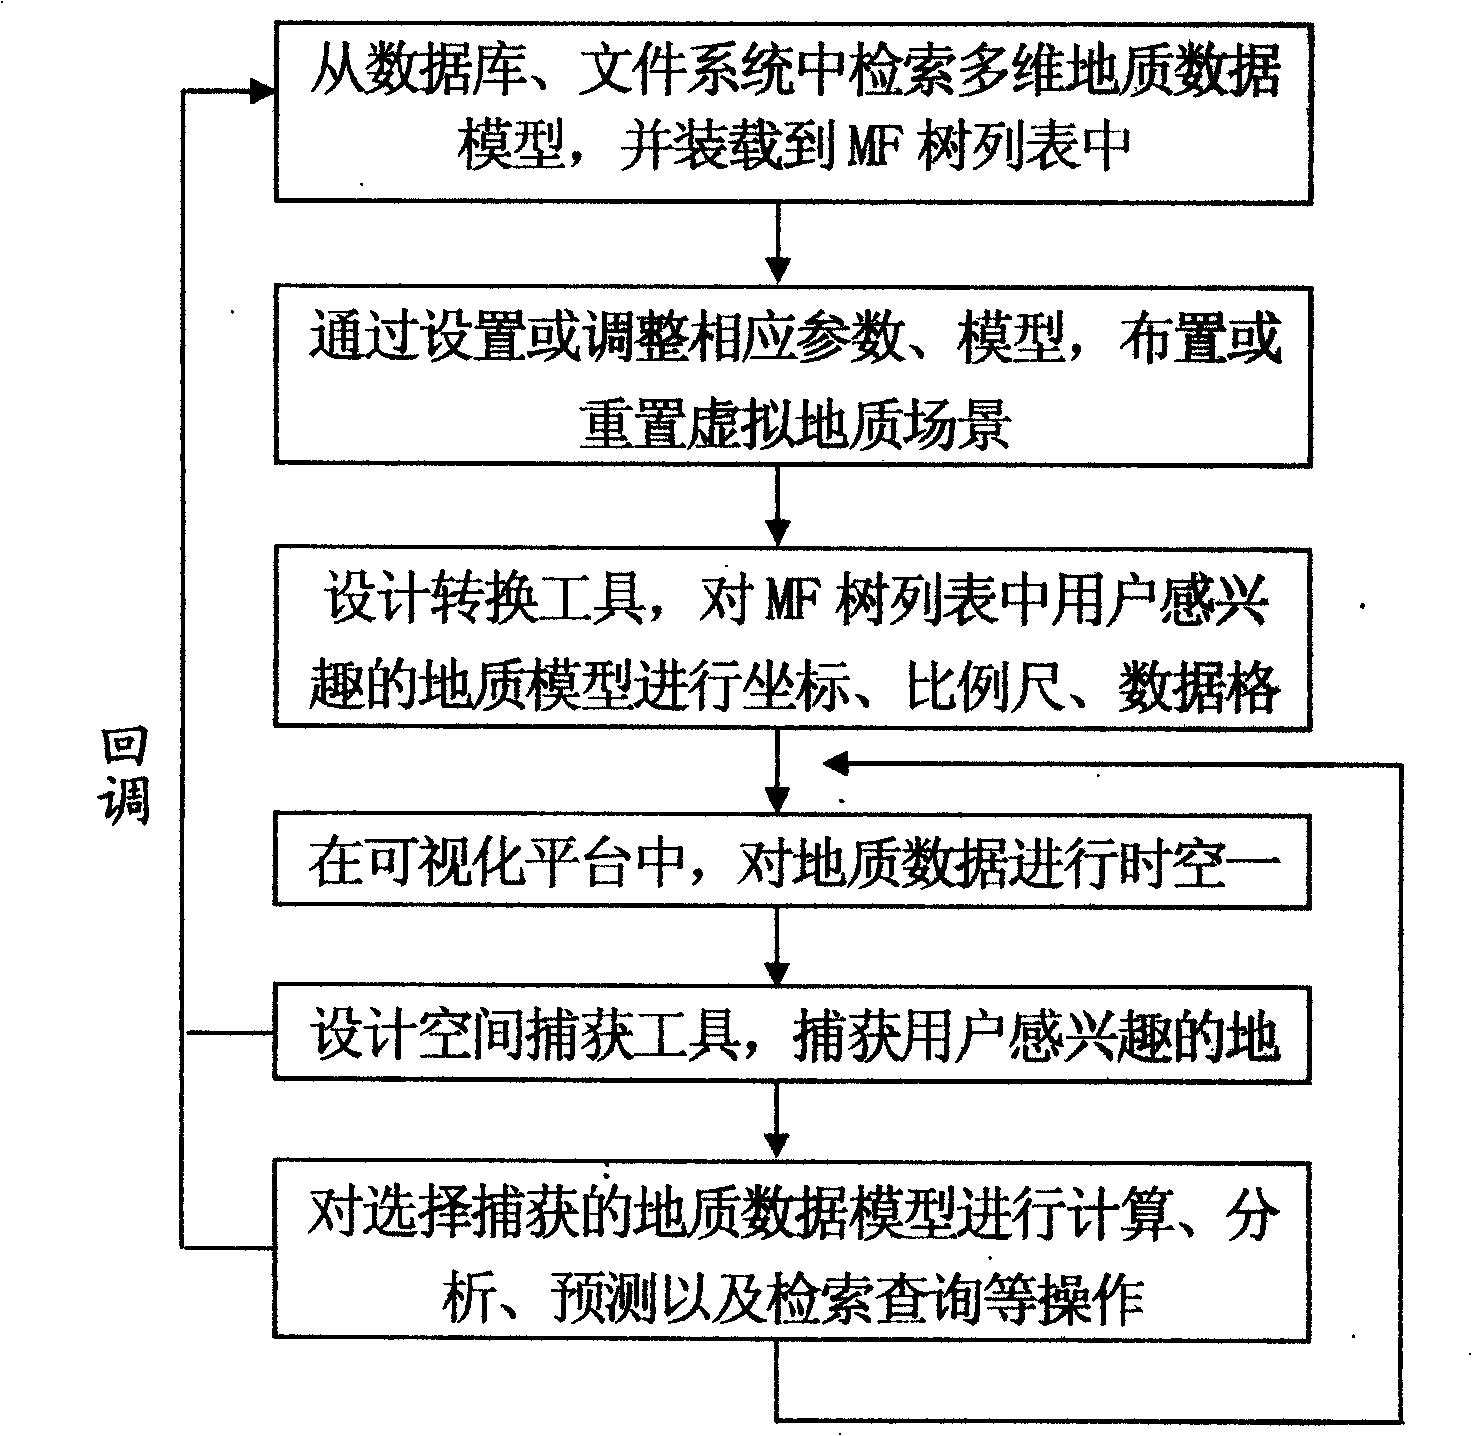
[0136] Take the visual analysis and prediction method based on virtual geological model of a mine in Kailuan Mining Group as an example.

[0137] Firstly, multi-dimensional geological data models are retrieved from the database and file system, mainly including: 27 strata / volume models, 49 fault models, 13 stratum boundary models, 10 contour models, a set of borehole models, 7 Section model, 2 fold models, and a series of related attribute data, such as stratum attribute data, fault element data, fold element data, etc. These data models are respectively loaded into the leaf node positions of the corresponding pointer lists in the MF tree list.

[0138] Layout the virtual geological scene, the main parameters are set to: the size of the visualized window window (tree type object manager window=(229,440); display window=(500,440)), the origin of the X / Y / Z three-dimensional initial coordinates Position (6250.789, 9637.06, -1228), coordinate system (XYZ, take the 4-bit relative ...

Embodiment 2

[0145] Take the visual analysis and prediction method based on virtual geological model of a mine in Xingtai Mining Group as an example.

[0146] Firstly, the multi-dimensional geological data model is retrieved from the database and file system, mainly including: 16 stratum layer / volume models, 21 fault models, 3 stratum boundary models, 4 contour models, two sets of borehole models, 41 Section model, and a series of related attribute data, such as stratum attribute data, fault element data, etc. These data models are respectively loaded into the leaf node positions of the corresponding pointer lists in the MF tree list.

[0147]Layout the virtual geological scene, the main parameters are set to: the size of the visualized window window (tree type object manager window=(229,440); display window=(500,440)), the origin of the X / Y / Z three-dimensional initial coordinates Position (38521496.0, 4080949.5, -566.00012), coordinate system (XYZ, take the absolute coordinates of the mo...


PUM


Abstract

A visual analyzing and predicting method based on a virtual geological model is finished by depending on an interactive visual tool. The method mainly comprises steps of searching a multi-dimensional geological data model from a database and a file system; arranging or resetting a virtual geological scene by setting or regulating corresponding parameters and models; regulating coordinate, scale, data format and the like, of the geological model; sending results of visual calculating, analyzing, predicting and searching into a dual-display cache region; and integrally displaying geological data in a visual platform at real time. The method meets requirements of earth science application, enhances representability of geological data, improves comprehension and application environment of geological data, converts logical thinking of geologists into a trial ground having an imagery thinking of time and space in a virtual environment, helps strengthen deep recognition to complex geological phenomena, uncovers deep information and internal relation in geological data, digs out and extract knowledge unable to be obtained in a traditional mode, improves utilization rate and geospatial analytics of information, and provides a brand-new method for geologists to observe, explain, analyze and imitate geological phenomena in a three-dimensional space, predict and know geospatial distribution of geological structure in a studied area through known data, and obtain mine position, mine reserves and other important information. Furthermore, the human-computer interactive tool is simple and easy to learn to operate, saves cost, reduces blindness in application, reduces risk, conducts and makes decision for production and environment analysis and has significant economic and social benefits.

Description

technical field [0001] The invention relates to the fields of computer technology and exploration geology technology, in particular to a visual analysis and prediction method in a three-dimensional geological simulation system. Background technique [0002] Scientific visualization is a new research field proposed and developed by developed countries in the late 1980s. It is a key research topic in the application of engineering science today. Its technical level is developing from background processing to real-time tracking and interactive control. The theory, method and technology that the data and its changes and final results involved in the process of calculation, analysis, prediction, etc. are directly displayed in the form of graphics and images and processed interactively. Various concrete or abstract geological models can be displayed in real time, visually and intuitively through visualization technology. In the early 1990s, the theory and technology of three-dime...

Claims


Application Information

Patent Timeline
IPC IPC(8): G06T15/00G06T17/00G06F17/30
Inventor 武强徐华
Owner BEIJING INSTITUTE OF PETROCHEMICAL TECHNOLOGY
Why Eureka
Try Eureka