Method for quantitatively analyzing myocardium acoustic contrast image

A quantitative analysis and myocardial technology, applied in medical science, acoustic wave diagnosis, infrasonic wave diagnosis, etc., can solve problems such as cumbersome operation, inability to automate the registration process, and failure to consider position changes

Inactive Publication Date: 2009-09-23
SHANDONG UNIV
View PDF0 Cites 13 Cited by
  • Summary
  • Abstract
  • Description
  • Claims
  • Application Information

AI Technical Summary

Problems solved by technology

That is, this type of software does not consider the position change of the ROI area on different frames of the MCE image sequence caused by the misalignment between frames of the MCE image sequence
Obviously, the accuracy and clinical validity of quantitative analysis of MCE images using this type of software is open to question
Another type of MCE quantitative analysis software uses manual or interactive processing methods to deal with the position changes of the selected ROI area on different frames of the MCE image sequence, such as the Vivid7 ultrasound equipment of GE Company, which is used during the playback of ultrasound sequence images. In this method, the observer is allowed to manually change the position of the selected ROI area in the frame where the position of the selected ROI area is "drifted". depends largely on the experience and knowledge of the clinician
According to another investigation, so far, some scholars have paid attention to the position change of the ROI region on different frames of the MCE image sequence caused by the misalignment between frames of the MCE image sequence, such as Dr. M.L.Lope (2003) in the article Improving Myocardial Contrast EchocardiographyImages Registration by In Increasing Images Similarity, a semi-automatic elastic registration algorithm for MCE ultrasound sequence images is proposed based on segmentation-based and pixel-attribute-based image registration techniques. The registration accuracy and effectiveness of the algorithm depend on the template manually selected in the segmentation stage. , the registration process cannot be automated, and the computational efficiency and robustness are not ideal

Method used


Image

  • Method for quantitatively analyzing myocardium acoustic contrast image
  • Method for quantitatively analyzing myocardium acoustic contrast image
  • Method for quantitatively analyzing myocardium acoustic contrast image

Examples


Embodiment

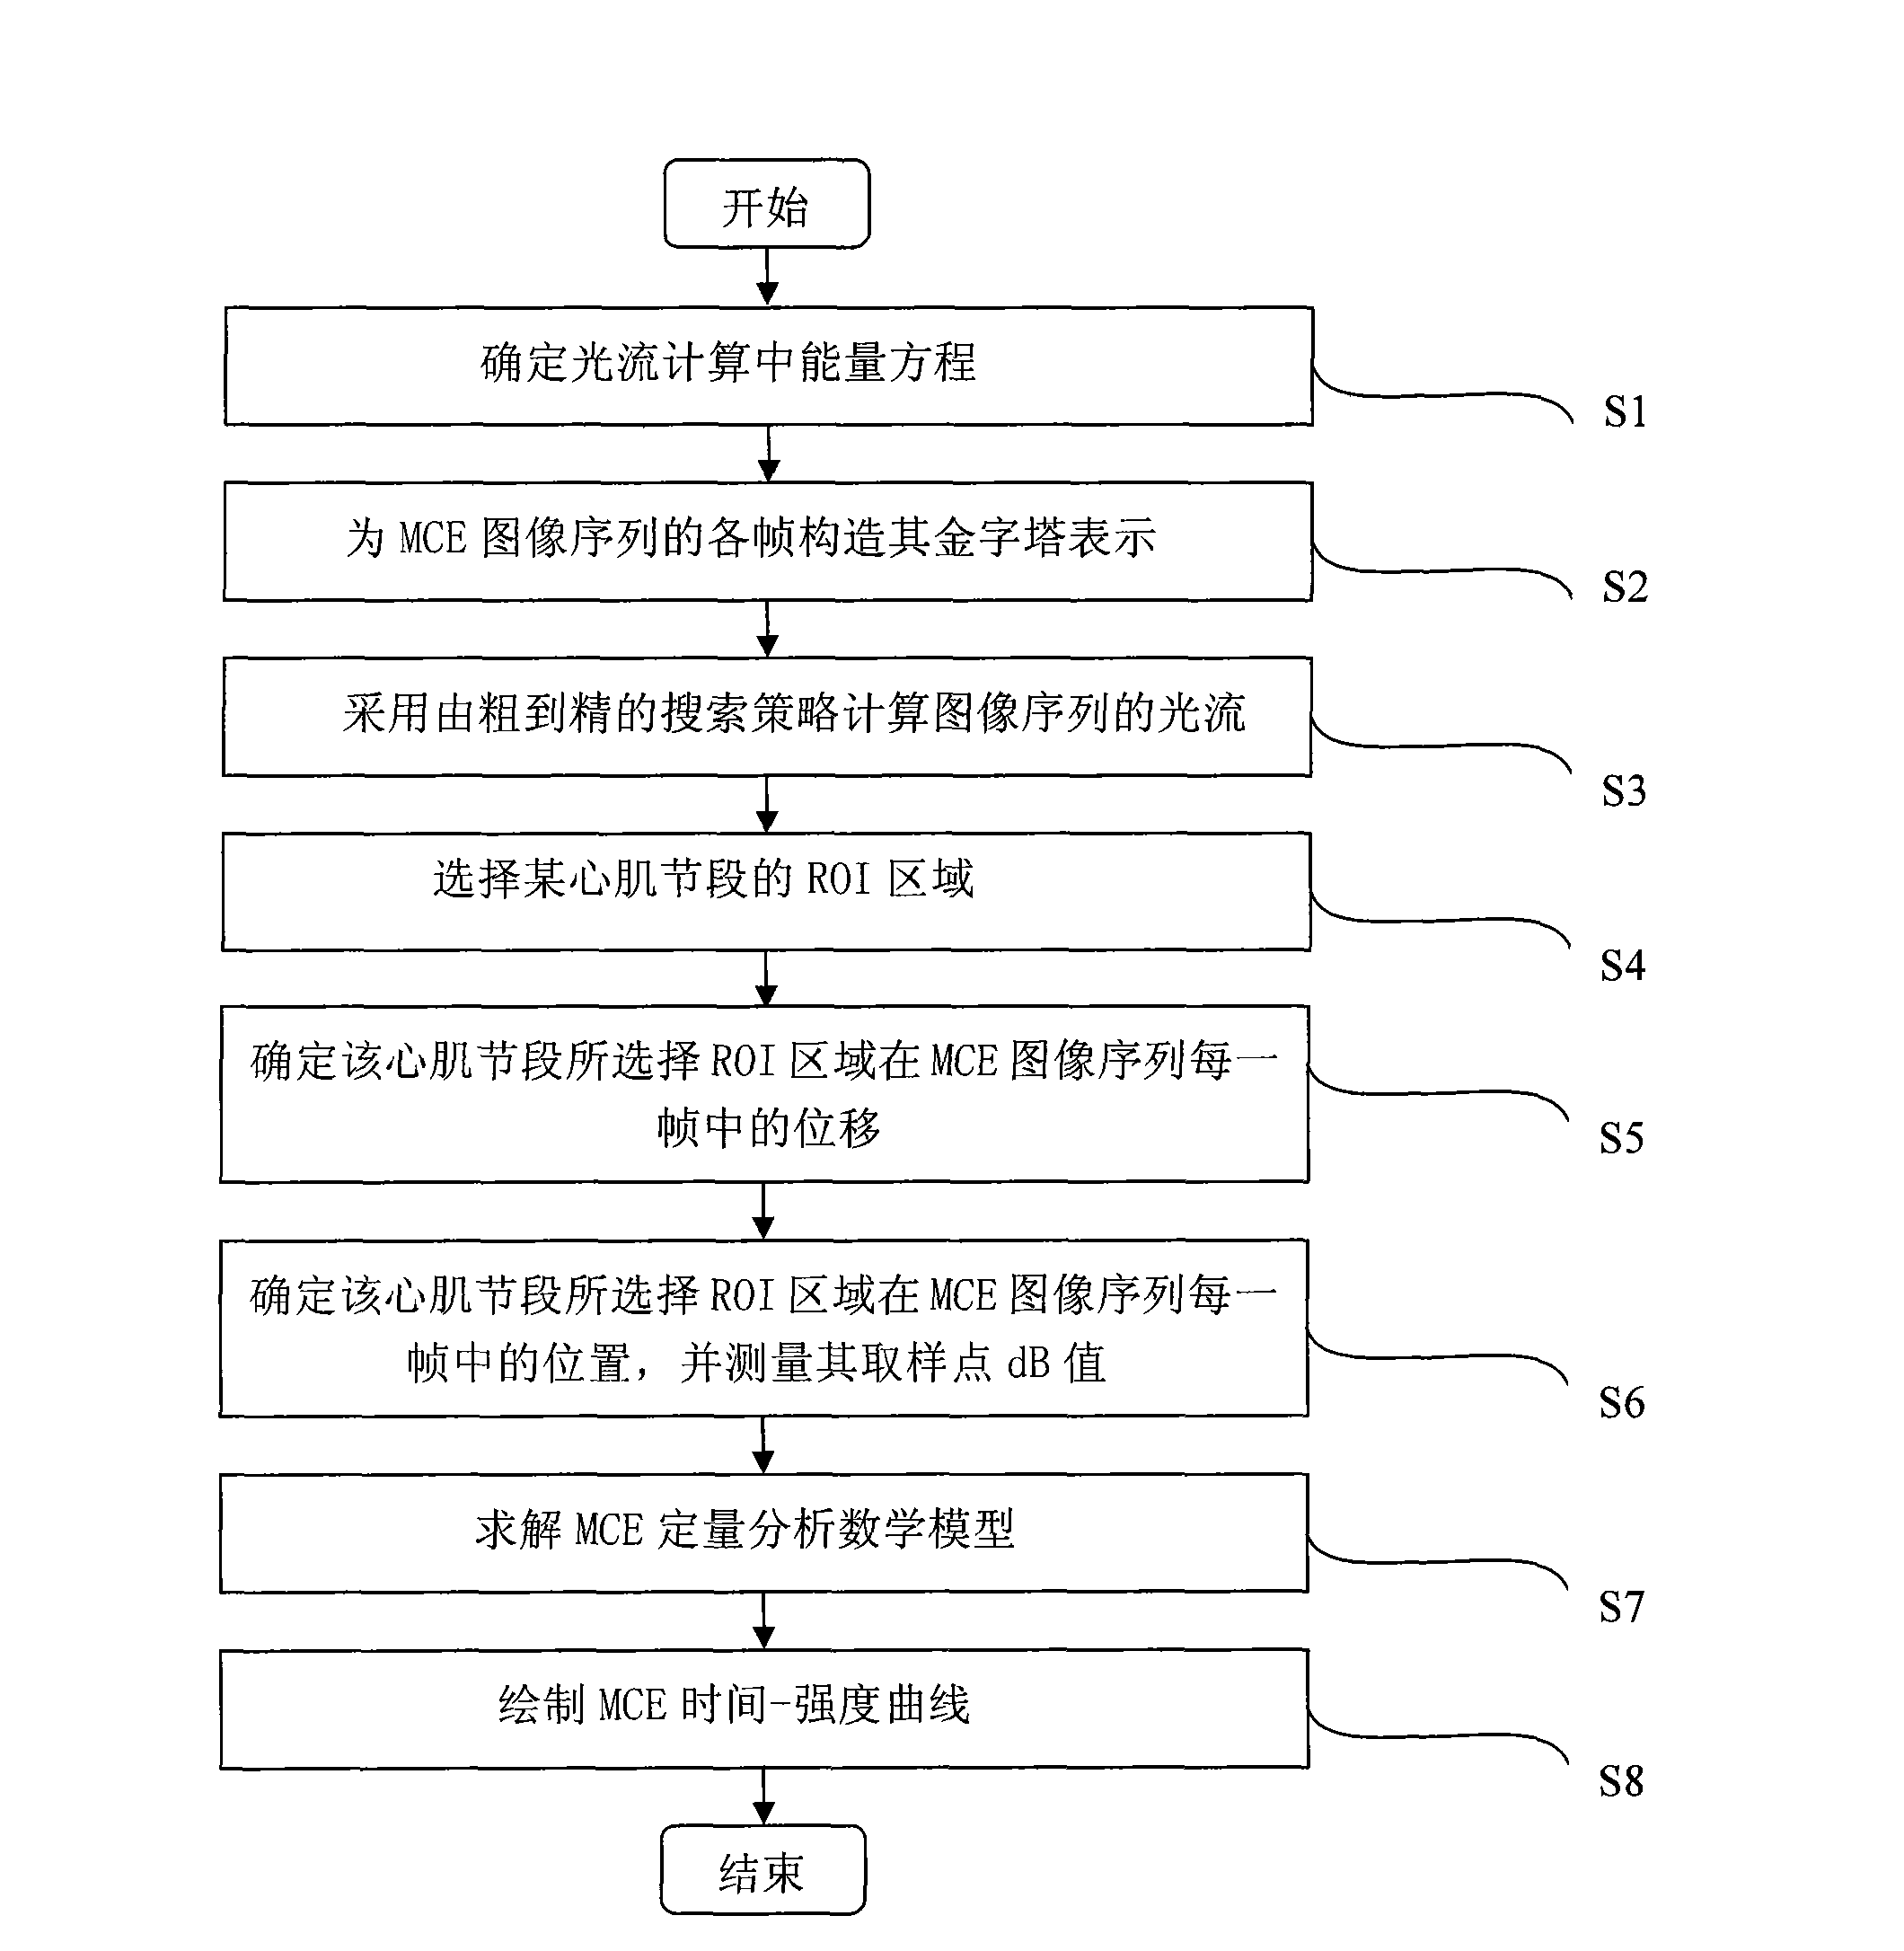
[0065] A MCE quantitative analysis method based on optical flow calculation speckle tracking technology, the steps are as follows:

[0066] S1) Determine the energy equation in optical flow calculation

[0067] According to the optical flow constraint equation, gradient constraint equation and smooth constraint condition, the total energy equation is obtained, and the formula is as follows:

[0068] E(u,v)=E Data +αE Smooth

[0069] E Data ( u , v ) = ∫ Ω ( | I ( X + W ) - I ( X ) | 2 ...


PUM


Abstract

The invention relates to a method for quantitatively analyzing a myocardium acoustic contrast image, which belongs to the technical field of medical image analysis and processing. The method comprises the following steps: determining an energy equation in optical flow calculation; constructing pyramid expressions of each frame of a myocardium acoustic contrast image sequence; calculating an optical flow field of the image sequence by adopting a searching policy from roughness to precision; selecting an ROI area of a myocardium segment; determining displacements of the selected ROI area of the myocardium segment in each frame of the myocardium acoustic contrast image sequence; determining positions of the selected ROI area of the myocardium segment in each frame of the myocardium acoustic contrast image sequence and measuring dB values of sampling points of the positions; determining unknown parameters in a quantitative analysis mathematical model of the myocardium acoustic contrast; and drawing a time-intensity curve of the myocardium acoustic contrast. The method achieves the full automation of the quantitative analysis of the myocardium acoustic contrast image and has accurate analysis result and high clinical effectiveness and objectivity.

Description

(1) Technical field [0001] The invention relates to a method for quantitative analysis of myocardial acoustic contrast images, in particular to a method for quantitative analysis of myocardial acoustic contrast images based on optical flow field calculation speckle tracking technology. (2) Background technology [0002] In the clinical application of myocardial contrast echocardiography (Myocardial Contrast Echocardiography, MCE) image quantitative analysis, people obtain the coronary microcirculation hemodynamic parameters of a certain myocardial segment through the MCE time-intensity curve, such as blood volume, blood flow velocity, Blood flow, etc. are used by clinicians to quantitatively evaluate myocardial perfusion. The general principle of MCE image quantitative analysis is to measure the dB value of a sampling point in a selected region of interest (Region of Interest, ROI) of a certain myocardial segment. Here, the center of the ROI area is called a sampling point,...

Claims


Application Information

Patent Timeline
Patent Type & Authority Applications(China)
IPC IPC(8): A61B8/00A61B8/06
Inventor 孙丰荣贾晓波张明强王晓婧
Owner SHANDONG UNIV
Why Eureka
Try Eureka