

Medical image processing apparatus
An image processing device and medical technology, applied in the field of medical image processing, can solve the problems of decreased detection accuracy, false detection and the like
- Summary
- Abstract
- Description
- Claims
- Application Information
AI Technical Summary
Problems solved by technology
Method used
Image


Examples
Embodiment 1
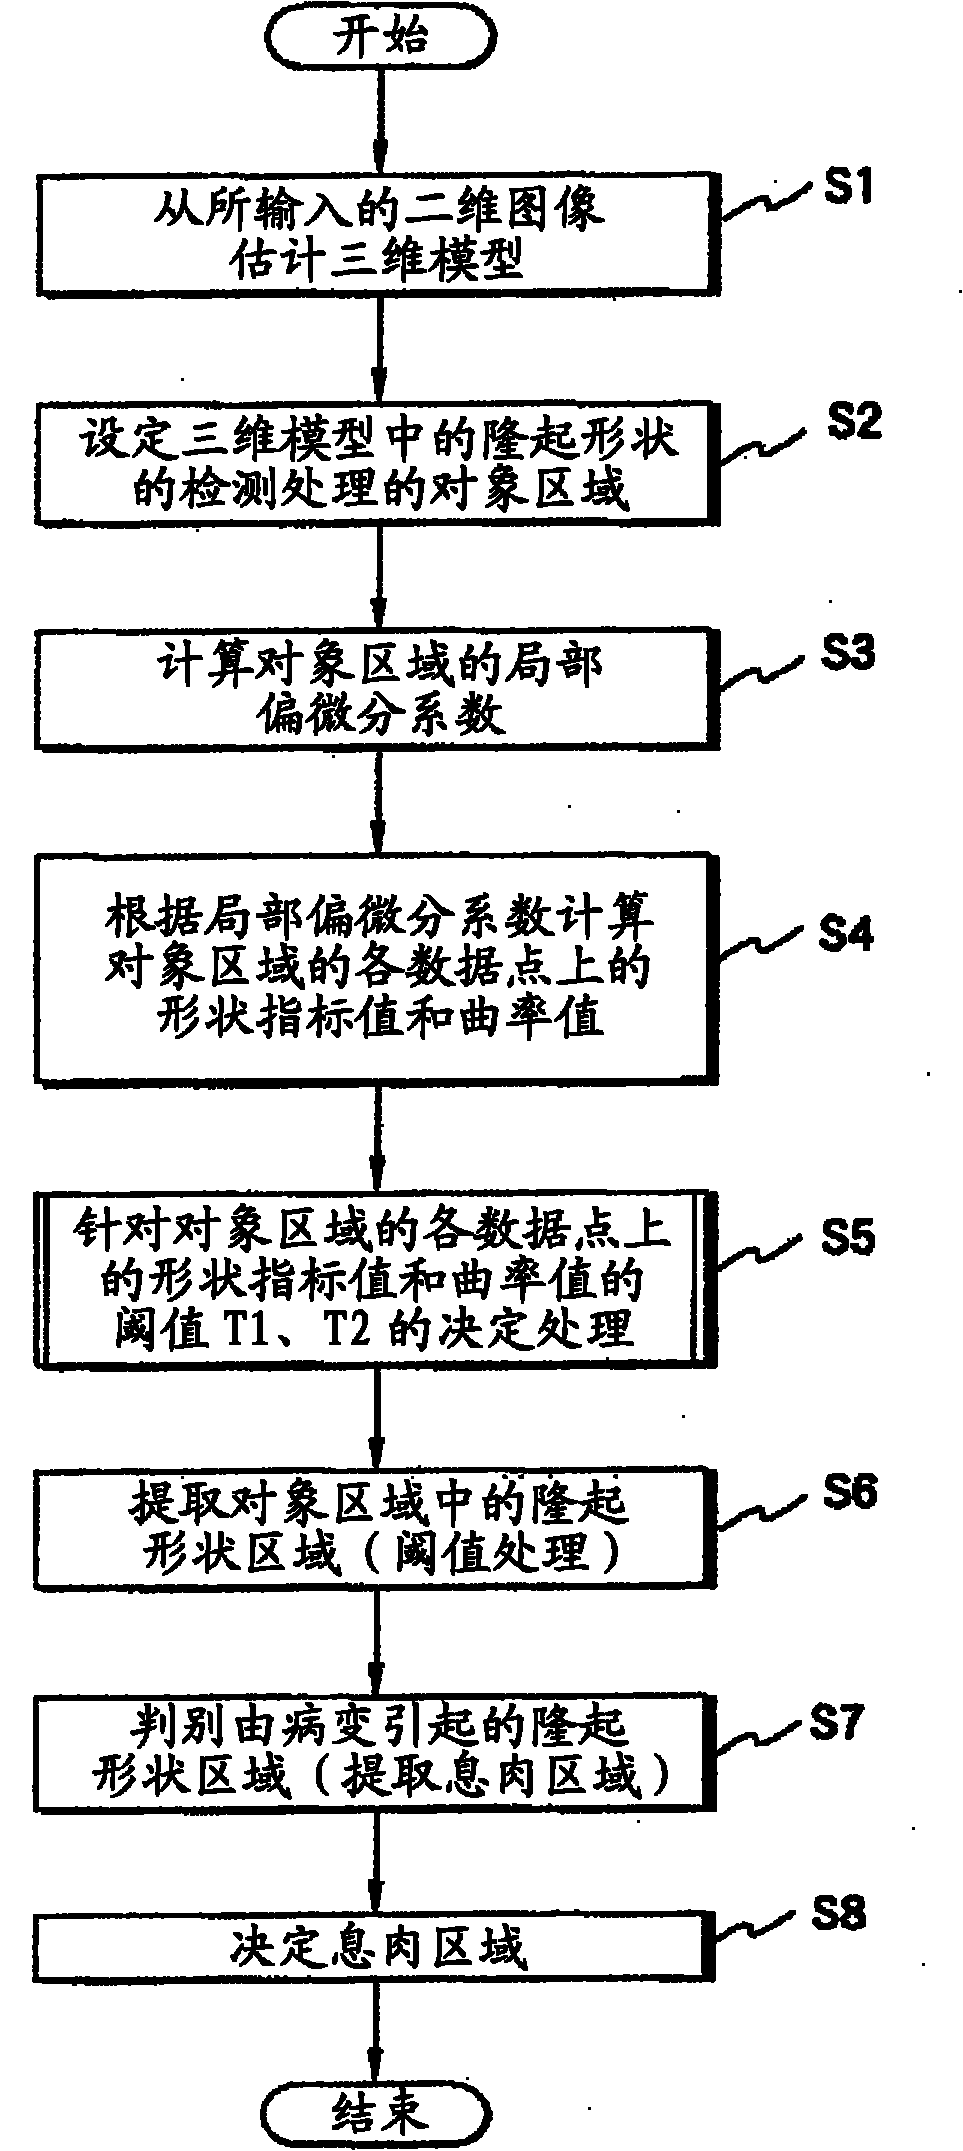
[0037] Figure 1 to Figure 6 Relating to embodiment 1 of the present invention, figure 1 is a diagram showing an example of an overall configuration of an endoscope system used in a medical image processing device, figure 2 is showing figure 1 A functional block diagram of the functional structure of the CPU, image 3 is showing figure 2 The flowchart of the processing flow of the CPU, Figure 4 is showing image 3 The flow chart of the decision processing flow of the thresholds T1 and T2, Figure 5 is shown in Figure 4 A plot of the "Z coordinate - threshold T1, T2" threshold table data used in the processing, Image 6 is description Figure 4 processed diagram.
[0038] like figure 1 As shown, the main parts of the endoscope system 1 of this embodiment are configured to include a medical observation device 2 , a medical image processing device 3 , and a monitor 4 .
[0039] The medical observation device 2 is an observation device that captures a subject and ou...
Embodiment 2
[0085] Figure 7 to Figure 11 Relating to embodiment 2 of the present invention, Figure 7 is a flowchart showing the flow of determination processing of the thresholds T1 and T2, Figure 8 is shown in Figure 7 A plot of the "Included Angle - Multiplied Value" threshold table data used in the processing, Figure 9 is description Figure 7 Figure 1 of the processing, Figure 10 is description Figure 7 Figure 2 of the processing, Figure 11 is description Figure 7 Figure 3 of the treatment.
[0086] The difference between the second embodiment and the first embodiment lies in the determination process of the thresholds T1 and T2 for comparison with the shape index value and the curvature value. Since the structure is the same as that of the first embodiment, only the difference will be described.
[0087] In the process of determining the thresholds T1 and T2 to be compared with each value of the shape index value and the curvature value in this embodiment, as Figur...
Embodiment 3
[0102] Figure 12 to Figure 16 Relating to embodiment 3 of the present invention, Figure 12 is a diagram explaining calculation processing of local partial differential coefficients, Figure 13 is showing Figure 12 The flow chart of the calculation processing flow of the local partial differential coefficient, Figure 14 is showing Figure 13 The flow chart of the determination processing flow of the thresholds T1 and T2 in the subsequent stage of processing, Figure 15 is shown in Figure 13 The graph of the corresponding threshold value table between the number of data points Mi used in the processing of and the threshold values T1, T2, Figure 16 is showing Figure 13 A flowchart of the flow of a modified example of the calculation process of the local partial differential coefficient.
[0103] The difference between embodiment 3 and embodiment 1 lies in the calculation process of the local partial differential coefficient ( image 3 Step S3) and the determinati...
PUM
 Abstract
Description
Claims
Application Information