
Three-dimensional information comparative analysis method based on gas chromatography-mass spectrometry analysis data

A technology of comparative analysis and gas chromatography, which is applied in the direction of analyzing materials, material separation, measuring devices, etc., can solve the problems of indistinguishability, difficulty in spectrum analysis, limited sample separation ability, etc., and achieve the effect of strong practicability

Active Publication Date: 2012-07-18
CHINA TOBACCO HUNAN INDAL CORP
View PDF4 Cites 11 Cited by
  • Summary
  • Abstract
  • Description
  • Claims
  • Application Information

AI Technical Summary

Problems solved by technology

[0002] Existing sample composition analysis techniques have their own advantages and disadvantages. For the qualitative and quantitative analysis of low boiling point and volatile components in samples, gas chromatography-mass spectrometry analysis technology is currently the most commonly used and reliable analysis method, but this method has The sample separation ability is limited, some samples with similar components and different sources, the total ion chromatograms obtained by gas chromatography analysis technology are very similar, and cannot be distinguished
The more popular comprehensive two-dimensional gas chromatography analysis technology can better solve the defect of gas chromatography separation ability, but it has a large number of ghost peaks (ghost peaks refer to chromatographic elution peaks that cannot be qualitatively analyzed in chromatographic analysis, also known as false peaks). Peaks come from a variety of sources, such as the loss of stationary liquid in the chromatographic column, thermal decomposition or catalytic decomposition products of certain substances, etc.), and the phenomenon of multiple peaks of the same component is common, resulting in redundant information in the comprehensive two-dimensional spectrum Huge quantity, difficult to analyze spectrum

Method used


Image

  • Three-dimensional information comparative analysis method based on gas chromatography-mass spectrometry analysis data
  • Three-dimensional information comparative analysis method based on gas chromatography-mass spectrometry analysis data
  • Three-dimensional information comparative analysis method based on gas chromatography-mass spectrometry analysis data

Examples


Embodiment 1

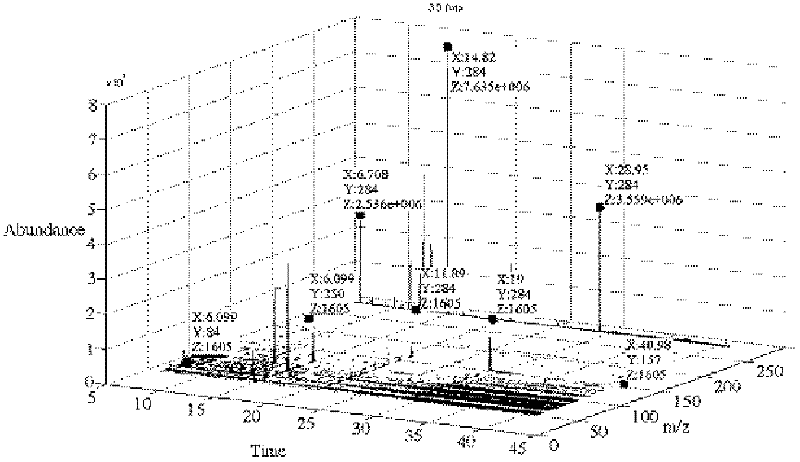
[0039] After the sample is analyzed by gas chromatography-mass spectrometry, the total ion flow diagram and mass spectrum are obtained. After the above two two-dimensional spectra are superimposed, a three-dimensional spectrum can be obtained, as shown in figure 1 shown. from figure 1 The abundance values ​​of various fragment ions at each retention time can be clearly observed in the graph. The three-dimensional map can conveniently display the three-dimensional coordinates of each point, that is, the retention time, mass-to-charge ratio and abundance value of each coordinate point. Abundance values ​​are displayed in different shades.

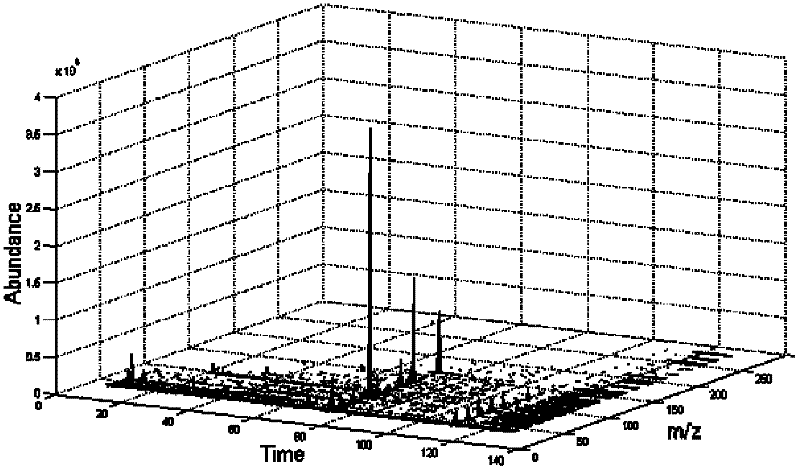
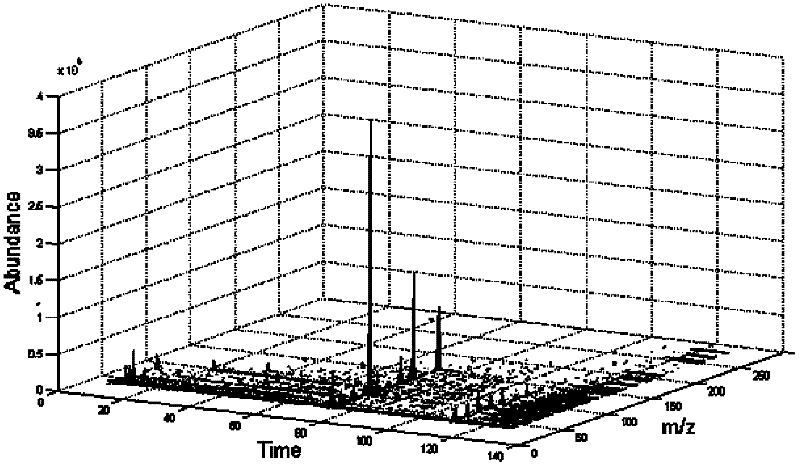
[0040] The present invention selects two control samples (in order to embody the meaning of the present invention, selects two relatively similar control samples of composition) and carries out illustration, figure 2 is the three-dimensional stereogram of sample No. 1, image 3 is the three-dimensional stereogram of sample No. 2, Figur...


PUM


Abstract

The invention discloses a three-dimensional information comparative analysis method based on gas chromatography-mass spectrometry analysis data. The three-dimensional information comparative analysis method comprises the steps of: 1, superposing a total ion chromatorgraphy and a mass spectrogram of a sample obtained by a gas chromatography-mass spectrometry combined instrument to obtain a three-dimensional omnibearing spectrogram of the sample, wherein the three-dimensional omnibearing spectrogram regards retention time, mass-to-charge ratio and abundance as three-dimensional coordinate axes; 2, performing comparative superposition or differentiation deduction on three-dimensional omnibearing spectrograms of different samples to further perform characteristic analysis on spectrograms of the samples and realize comparative analysis on components of different samples; and 3, analyzing overlapped peaks. The three-dimensional information comparative analysis method based on the gas chromatography-mass spectrometry analysis data, disclosed by the invention, has the advantages of being able to realize comparative analysis on components of different samples and component analysis on the overlapped peaks.

Description

technical field [0001] The invention relates to a three-dimensional information comparative analysis method based on gas chromatography-mass spectrometry analysis data, which can be applied to the fields of food, chemical quality inspection, etc., especially the component analysis and quality monitoring of cigarettes, tobacco components and tobacco additives, including chromatographic comparison. Analysis of tobacco components that are difficult to separate, quality comparison analysis of tobacco components and tobacco additives under different batches and different processing conditions, etc. Background technique [0002] Existing sample composition analysis techniques have their own advantages and disadvantages. For the qualitative and quantitative analysis of low boiling point and volatile components in samples, gas chromatography-mass spectrometry analysis technology is currently the most commonly used and reliable analysis method, but this method has The ability to sepa...

Claims


Application Information

Patent Timeline
IPC IPC(8): G01N30/86
Inventor 孔波杨华武卢红兵庹苏行赵瑜谭新良钟科军
Owner CHINA TOBACCO HUNAN INDAL CORP
Learn More