Method for detecting quality of edible oil by using hydrogen-nuclear magnetic resonance spectroscopy
A technology of hydrogen nuclear magnetic resonance spectrum and edible oil, which is applied in the field of nuclear magnetic resonance spectrum detection and identification of edible oil quality, can solve the problems of complex and changeable components, and cannot explain the composition clearly, so as to simplify the experimental steps, reduce the workload and improve the accuracy high effect
- Summary
- Abstract
- Description
- Claims
- Application Information
AI Technical Summary
Problems solved by technology
Method used
Image
Examples
preparation example Construction
[0032] 3. Preparation of test samples
[0033]Take 20 microliters of soybean oil, add 0.6mL CDCl 3 dissolved in Φ 5mm sample tube to get the sample solution to be tested. According to this method, 14 parts of soybean oil, 14 parts of peanut oil, 12 parts of sesame oil, 7 parts of palm oil, 6 parts of corn oil, 7 parts of cottonseed oil, 7 parts of rapeseed oil, 7 parts of sunflower oil and 8 parts of blended oil were obtained.
[0034] 4. Test process
[0035] 1. Spectrometry
[0036] Determination conditions: temperature: 295K, CDCl 3 For internal locking, each spectrum is scanned 16 times, the spectrum width is 20ppm, the pulse interval is 2s, and the pulse sequence is zg30.
[0037] The sample solution prepared above was measured on the nuclear magnetic resonance instrument 1 H NMR spectrum to obtain the free decay signal (FID signal) of the sample.
[0038] 2. Spectrum processing and integration
[0039] The FID signal of the sample obtained from the above measure...
Embodiment 1
[0091] Example 1 Discrimination of edible oil by direct use of integral area through two-dimensional graph
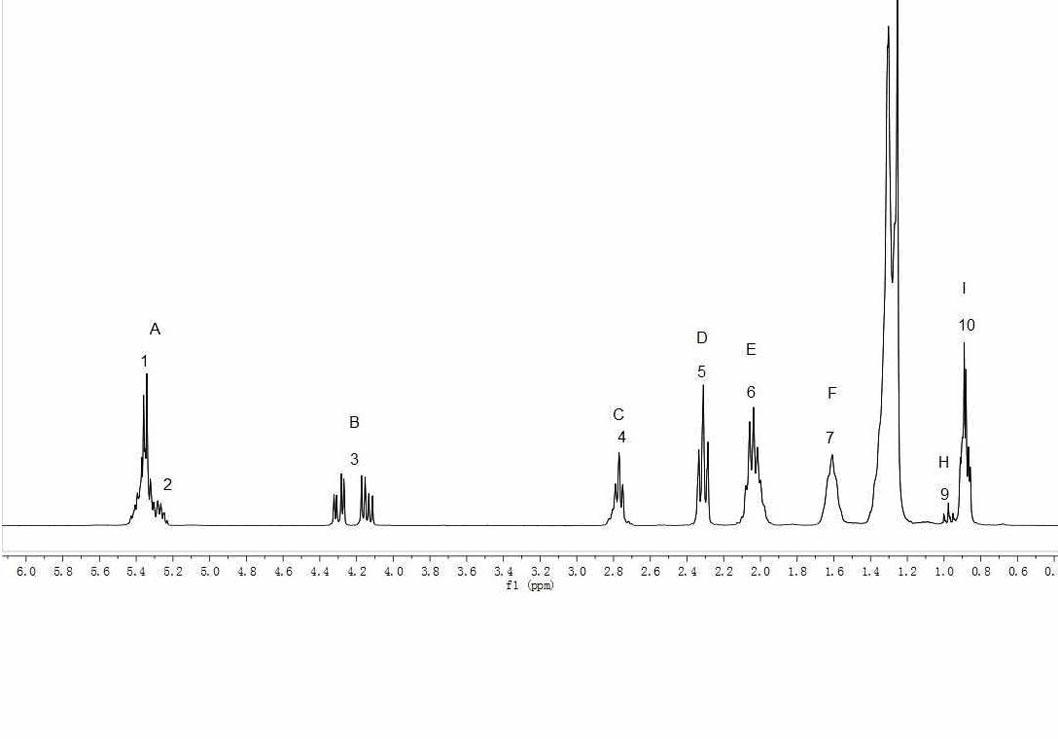
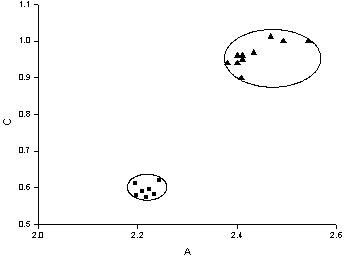
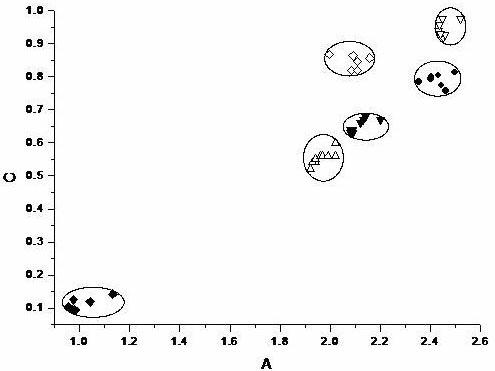
[0092] The standard sample was tested and integrated by proton nuclear magnetic resonance spectrum according to the above method. It was found through experiments that only soybean oil and rapeseed oil had No. 9 peak among common edible oils. The two-dimensional plane diagram made by using the integral values A and C, as attached figure 2 And attached image 3 , as the standard database.
[0093] It can be seen from the accompanying drawings that various oils can be completely separated. The oils to be tested are tested and integrated by proton nuclear magnetic resonance spectrum according to the above method, and the integrated values A and C are compared with the established standard database for judgment.
[0094] For example, we add 5% waste oil sample to rapeseed oil and carry out H NMR spectrum test and integration according to the above method, and the o...
Embodiment 2
[0101] Example 2 Discrimination of grease by direct use of integral area through three-dimensional graph
[0102] The standard sample is tested and integrated by proton nuclear magnetic resonance spectrum according to the above method. Using the integrated values A, C, and E to make a three-dimensional map, various edible oils can be completely separated, as shown in the attached Figure 6 , as the standard database.
[0103] The edible oil to be tested was tested and integrated by proton nuclear magnetic resonance spectrum according to the above method, and its integral value A, C, E was used to compare with the standard database attached Figure 6 Compare and judge. For example
[0104] Table 21 The integral data of two peanut oil samples containing 10% waste oil are as follows
[0105] A B C D E F G H I 1.91 1.00 0.62 1.43 2.23 1.97 12.57 0.00 1.99 1.87 1.00 0.68 1.50 2.27 2.07 12.28 0.00 1.60
[0106] I...
PUM
 Abstract
Description
Claims
Application Information
 - R&D
- Intellectual Property
- Life Sciences
- Materials
- Tech Scout
- Unparalleled Data Quality
- Higher Quality Content
- 60% Fewer Hallucinations
Browse by: Latest US Patents, China's latest patents, Technical Efficacy Thesaurus, Application Domain, Technology Topic, Popular Technical Reports.
© 2025 PatSnap. All rights reserved.Legal|Privacy policy|Modern Slavery Act Transparency Statement|Sitemap|About US| Contact US: help@patsnap.com


