Simulation technology-based method for optimizing cutting parameters of ceramic cutting tool
A technology of ceramic tools and cutting parameters, which is applied in the direction of electrical digital data processing, special data processing applications, instruments, etc., to achieve the effect of improving processing quality, prolonging service life and reducing processing costs
- Summary
- Abstract
- Description
- Claims
- Application Information
AI Technical Summary
Problems solved by technology
Method used
Image

Examples
Embodiment 1
[0045] Select the workpiece material 45# hardened steel, the determined Johnson-Cook rheological model parameters (see Table 1), and physical parameters (see Table 2). Tool material is Al 2 o 3 / ZrO 2 (Y 2 o 3 ) Composite ceramic materials, passed the physical parameters of the test (see Table 3).
[0046] Table 1 Johnson-Cook model parameters of 45# hardened steel
[0047]
[0048] Table 2 Physical parameters of 45# hardened steel
[0049]
[0050] Table 3 Al 2 o 3 / ZrO 2 (Y 2 o 3 ) Physical parameters of composite materials
[0051]
[0052] The rheological equation that is substituted into the calculation results of the above parameters is:
[0053]
Embodiment 2
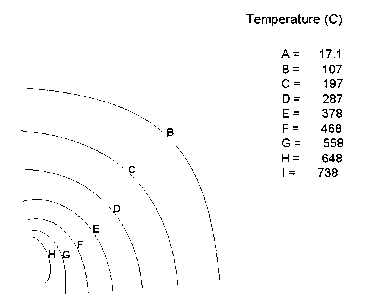
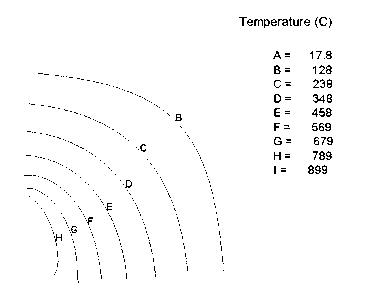
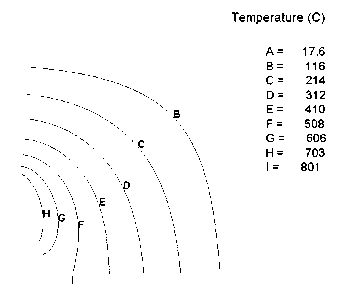
[0055] When the cutting speed of the actual test is 140m / min, the feed rate is 0.1mm / r, 0.2 mm / r, 0.3 mm / r, 0.4 mm / r, 0.5 mm / r, and five feed conditions are simulated The local steady-state temperature gradient curve of the lower blade (see Figure 1 (a); (b); (c); (d); (e)), it can be seen from Figure 1 that the high-temperature intensive area is mainly distributed on the rake face. Figure 2(a) and (b) represent the temperature curves of the front and flank surfaces respectively. From Figure 2, it can be seen that different feed rates have a significant impact on the temperature fields of the front and flank surfaces. When the feed rate is 0.1-0.4mm / r, the temperature of the front and flank surfaces near the tool tip is concentrated below 600°C. the
[0056] Figure 3 (a); (b); (c); (d); (e) is the steady state stress curve, from Figure 3 we can see that the maximum stress is concentrated at the tip of the tool, the maximum compressive stress is 1700MPa, Figure 4 (a) and (b) ...
Embodiment 3
[0059] According to the test cutting speed, the feed rate is selected as 0.1mm / r, and the cutting speed is 140m / min, 190m / min, 240m / min, 290m / min to obtain the steady-state temperature field distribution of the tool in four cases (Fig. 5(a) ; (b); (c); (d)), it can be seen from Figure 5 that the high temperature intensive area is mainly distributed on the rake face. Figure 6(a) and (b) show the temperature change curves at the front and back of the tool tip respectively. It can be seen from Figure 6 that when the cutting speed is 140m / min and 190m / min, the maximum temperature is less than 800°C, and at other cutting speeds The tip temperature is above 1000°C. From the analysis of Example 2, it can be seen that when the speed does not exceed 190m / min, the temperature of the front and flank surfaces near the tool tip is concentrated below 800°C, which belongs to the low-temperature processing zone.
[0060] Figure 7(a); (b); (c); (d) shows the steady-state stress gradient curve...
PUM
 Abstract
Description
Claims
Application Information
 - Generate Ideas
- Intellectual Property
- Life Sciences
- Materials
- Tech Scout
- Unparalleled Data Quality
- Higher Quality Content
- 60% Fewer Hallucinations
Browse by: Latest US Patents, China's latest patents, Technical Efficacy Thesaurus, Application Domain, Technology Topic, Popular Technical Reports.
© 2025 PatSnap. All rights reserved.Legal|Privacy policy|Modern Slavery Act Transparency Statement|Sitemap|About US| Contact US: help@patsnap.com