Fatigue crack spreading rate normalization forecasting method
A technology of fatigue crack growth and prediction method, which is applied in the field of normalized prediction of fatigue crack growth rate based on energy release rate, can solve problems such as lack of good unity and difficulty in accurate fatigue life prediction, and achieve simple form, Facilitate engineering application and reduce workload
- Summary
- Abstract
- Description
- Claims
- Application Information
AI Technical Summary
Problems solved by technology
Method used
Image
Examples
Embodiment 1
[0045] For the normalized prediction method of 4340 steel type I fatigue crack growth rate, the stress ratio is normalized to R=0, including the following steps:
[0046] First, establish a normalized prediction model for the fatigue crack growth rate
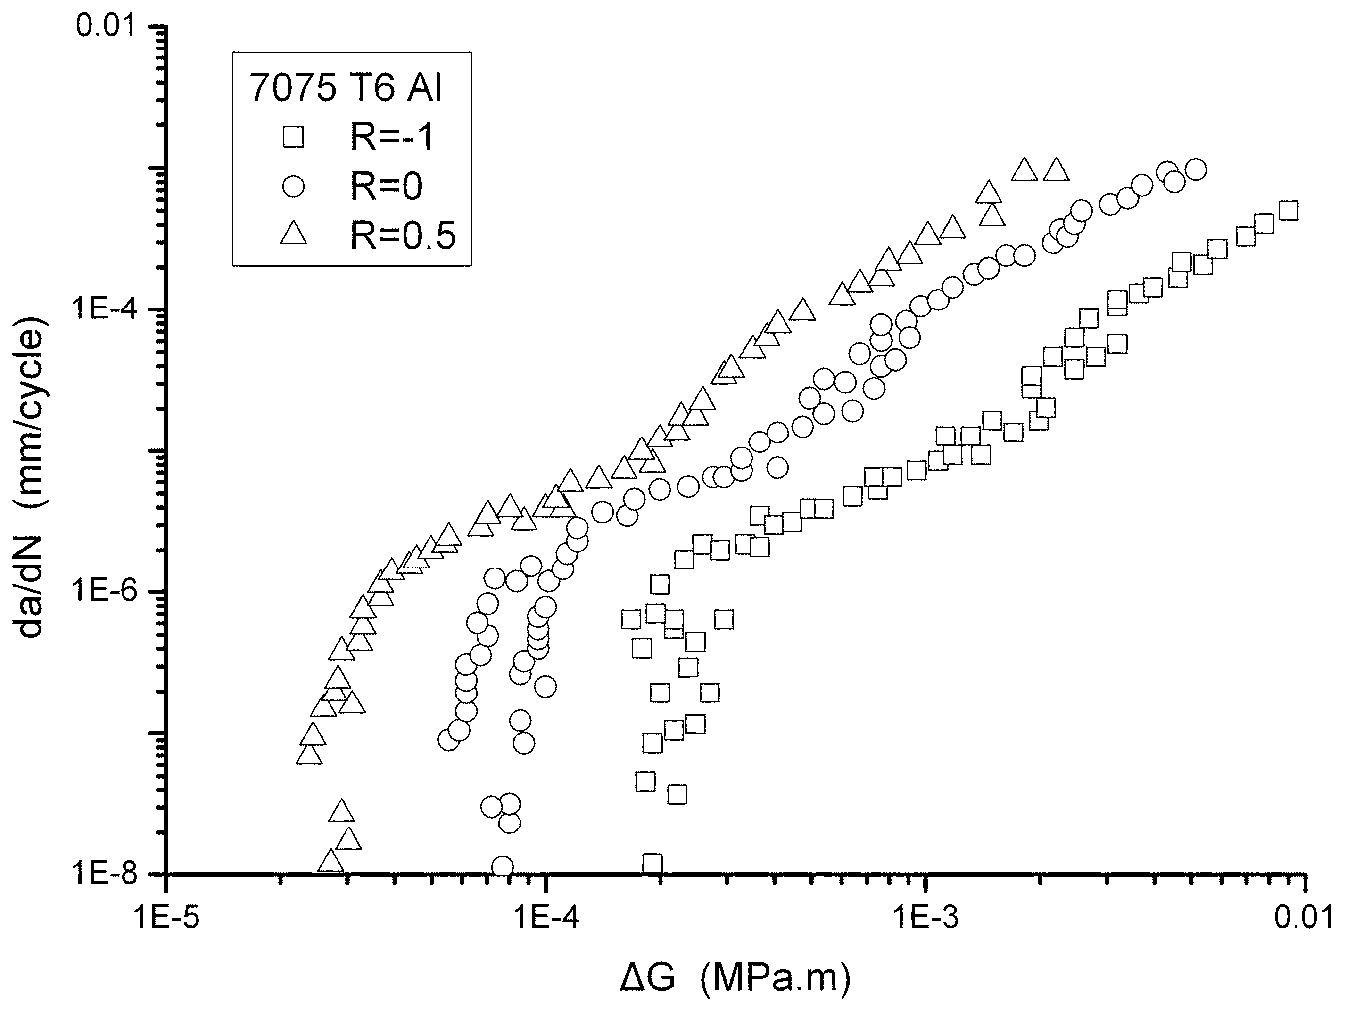
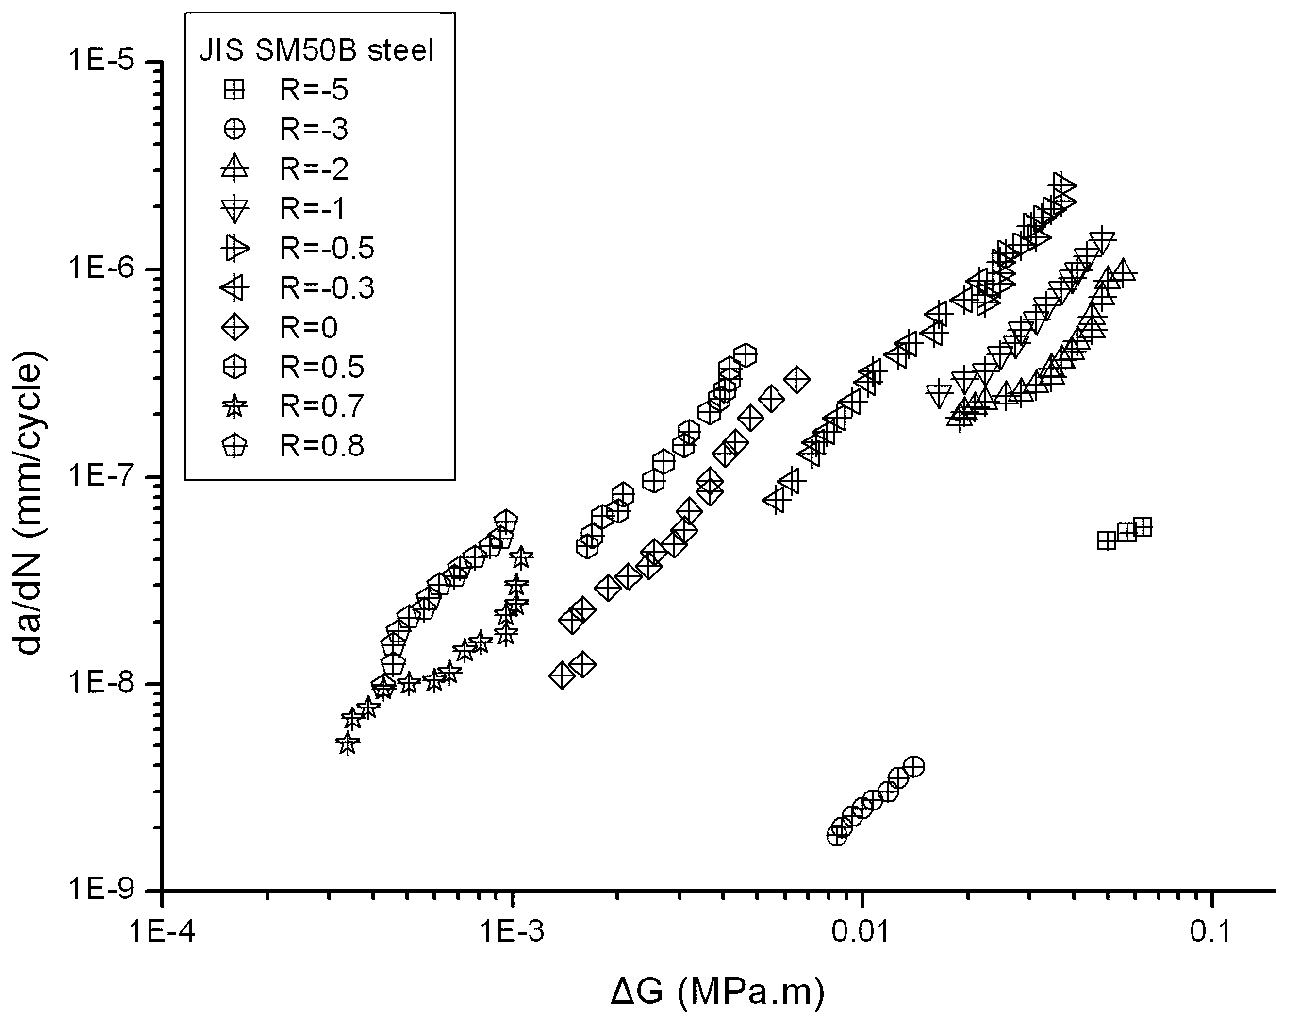
[0047] ① Plot the lg(da / dN)-lg(ΔG) data plot. Among them, 7075-T6 aluminum, stress ratio R=-1, 0 and 0.5 (see Figure 2 (a)); JIS SM50B steel, stress ratio R=-5, -3, -2, -1, -0.5, -0.3 , 0, 0.5, 0.7 and 0.8 (see Figure 2(b)); 2024-T351 aluminum (type1), the stress ratios are R=-1, 0, 0.1 and 0.3 (see Figure 3(a)); T351 aluminum (type2), stress ratio R=-2, -1, -0.5, 0, 0.1, 0.3, 0.5 (see Figure 3 (b)).
[0048] ②For the test data of R=0, the material constants obtained by fitting the above formula (1) through the least square method are: 7075-T6 aluminum, B=1.3115, m=1.3518, G th0 =6.29×10 -5MPam; JIS SM50B steel, B=0.0020, m=1.7236, G th0 =1.38×10 -3 MPam; 2024-T351 aluminum (type1), B=0.0003, m=1.1766, G th0 =5.55×10 ...
Embodiment 2
[0059] For the type III fatigue crack growth rate of 18G2A steel, the fatigue crack growth rate normalization prediction method based on the energy release rate normalizes the stress ratio to R=0, including the following steps:
[0060] First, draw the lg(da / dN)-lg(ΔG) fatigue crack growth rate data of 18G2A steel under the stress ratio R=-1, -0.5 and 0 on the log-logarithmic coordinates, see Figure 6 (a);
[0061] Second, the fatigue crack growth data under different stress ratios R is equivalent to R=0 using formula (7), and the stress ratio normalization coefficient M is equal to 0.2888 (R=-1), 0.4836 (R=-0.5) , the data distribution after equivalent is shown in Figure 6(b);
[0062] Third, the fatigue crack growth rate calculation formula based on the energy release rate (formula (1)), the material constant B=4×10 -5 , m=1.3170, the energy release rate change amplitude threshold ΔG th0 =1.0×10 -3 Mpam, the prediction curve of fatigue crack growth rate is obtained from t...
Embodiment 3
[0064] For the I-III fatigue crack growth rate of 18G2A steel, the fatigue crack growth rate normalization prediction method based on the energy release rate normalizes the stress ratio to R=0, including the following steps:
[0065] First, draw the lg(da / dN)-lg(ΔG) fatigue crack growth rate data of 18G2A steel under the stress ratio R=-1, -0.5 and 0 on the log-logarithmic coordinates, see Figure 7(a);
[0066] Second, the fatigue crack growth data under different stress ratios R is equivalent to R=0 using formula (7), and the stress ratio normalization coefficient M is equal to 0.2888 (R=-1), 0.4836 (R=-0.5) , the equivalent data distribution is shown in Figure 7(b);
[0067] Third, the fatigue crack growth rate calculation formula based on the energy release rate (formula (1)), the material constant B=4×10 -6 , m=1.1846, the energy release rate change amplitude threshold ΔG th0 =1.0×10 -3 Mpam, the prediction curve of fatigue crack growth rate is obtained from the data un...
PUM
 Abstract
Description
Claims
Application Information
 - R&D
- Intellectual Property
- Life Sciences
- Materials
- Tech Scout
- Unparalleled Data Quality
- Higher Quality Content
- 60% Fewer Hallucinations
Browse by: Latest US Patents, China's latest patents, Technical Efficacy Thesaurus, Application Domain, Technology Topic, Popular Technical Reports.
© 2025 PatSnap. All rights reserved.Legal|Privacy policy|Modern Slavery Act Transparency Statement|Sitemap|About US| Contact US: help@patsnap.com


