Method for detecting and evaluating coverage rate and capacity of wireless base station cell

A wireless base station and capacity detection technology, applied in wireless communication, electrical components, etc., can solve problems such as time-consuming, labor-intensive and efficient, and achieve the effect of saving manpower and material resources, saving construction costs, and optimizing network networking

Active Publication Date: 2014-07-30
NANKAI UNIV
5 Cites 8 Cited by

AI-Extracted Technical Summary

Problems solved by technology

[0003] The purpose of the present invention is to solve the problems of time-consuming, laborious and inefficient field test method for wirele...

Abstract

The invention discloses a method for detecting and evaluating the coverage rate and the capacity of a wireless base station cell. By collecting information such as the position coordinates of wireless base stations, the transmitting power and the like of a region to be detected and evaluated and setting up two-dimensional lines with the same signal to interference ratio or the same signal to noise ratio, based on preset threshold values, of all the base stations in the region through computer simulation, all the two-dimensional lines with the same signal to interference ratio form closed loop curves, the sum of the areas of the regions defined by all the closed loop curves is the total coverage area of the base stations in the region, and coverage rate and capacity calculation is conducted on the region to be detected and evaluated by computer programs through the statistical method. According to the method, certain material and labor can be saved in the wireless communication networking link, and the method has great value for optimizing network networking, saving construction cost of the base stations and the like.

Application Domain

Technology Topic

Signal-to-interference ratioReal-time computing +3

Image

  • Method for detecting and evaluating coverage rate and capacity of wireless base station cell
  • Method for detecting and evaluating coverage rate and capacity of wireless base station cell
  • Method for detecting and evaluating coverage rate and capacity of wireless base station cell

Examples

  • Experimental program(1)

Example Embodiment

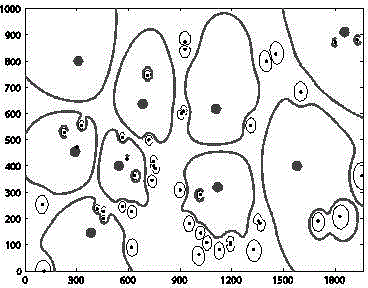
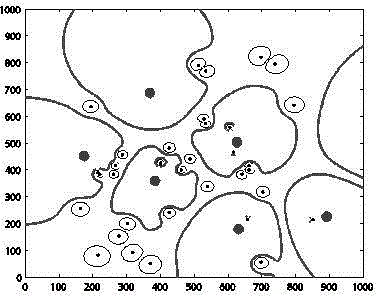
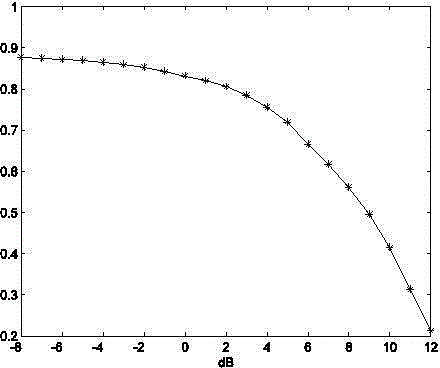
[0016] After determining the distribution coordinates and transmit power of wireless base stations in the detection and evaluation area, use computer software simulation to intuitively simulate the coverage of cell base stations based on a given signal-to-interference ratio threshold or signal-to-interference-to-noise ratio threshold. area, calculate the signal-to-interference ratio (SIR) or signal-to-interference-to-noise ratio (SINR) of each user, and compare it with the signal-to-interference ratio threshold or the signal-to-interference-noise ratio threshold. The final actual cell coverage is the percentage of the final value of the counter and the total number of virtual users, and the cell capacity is calculated using the previously calculated SIR value or SIR value and the capacity formula.
[0017] The present invention will be further described below with reference to the accompanying drawings.
[0018] In two-dimensional space, the ideal base station distribution is a lattice pattern that obeys rules, but the actual base station distribution, especially in heterogeneous networks, has strong random characteristics. A widely used assumption is that the base station distribution obeys the Poisson distribution. , Theory and practice have proved that Poisson distribution can better simulate the distribution characteristics of actual base stations in heterogeneous networks. Under the random characteristics of base station distribution, the calculation of coverage and capacity of cell networks becomes complicated, and there is currently no convenient method. Theoretical calculation method to guide.
[0019] Regardless of the cooperative communication between different network layers and between base stations in a single-layer network, for users in a heterogeneous network, when a user communicates with a base station in a certain network layer in the network, it meets a given threshold. (It is determined according to the specific communication environment, usually an integer value, such as a value of 3, that is, 4.7dB) In this case, the base station has a boundary area that can communicate with users. In the boundary area, the base station can provide services for users. Outside the zone, the signal is below the threshold Communication will not be possible, then, the area contained by the border is called the service area or coverage area of ​​the base station. For a user to communicate with a certain base station, other base stations become sources of interference, ignoring thermal noise, assuming that the user is at point z, the user and the user belonging to the K-th layer communication between base stations, the path attenuation factor is (usually taken as 4), the signal propagation undergoes Rayleigh attenuation, we can get the SINR expression at this time:
[0020]
[0021] in the formula for the first The signal-to-interference-noise ratio of each base station when communicating; for the first The signal power of each base station when communicating; for the first The interference power when the base stations are communicating, and respectively represent the base stations and non-th The transmit power of each base station, A collection of base stations.
[0022] Then, the coverage area of ​​the base station is the set of all points that satisfy the following formula:
[0023]
[0024] For simplicity, consider a two-layer heterogeneous network composed of macro base stations and micro base stations. Using Matlab simulation, we can draw the distribution of base stations and their corresponding coverage areas under different distribution models.
[0025] The specific operation steps of the wireless base station cell coverage and capacity detection and evaluation method are:
[0026] Assuming that the heterogeneous cell network area is S, the set of base stations in the area is , the coordinates of all base stations and the power of each base station are known, which is and , set a massive user set Evenly distributed in the area S, the coordinate z is known, and the threshold for establishing communication is ,.
[0027] 1. For each user , calculate the value , record the maximum value and the corresponding base station number k;
[0028] 2. Calculate the value:
[0029]
[0030] Counter initial value ,if , the counter is incremented by one,;
[0031] 3. Follow steps 1 and 2 to traverse all users , then the cell coverage is:
[0032] ;
[0033] The cell network capacity is:
[0034] .
[0035] as attached figure 1 and figure 2 Figure 1 shows the distribution of base stations based on the measured base station distribution data in Glasgow, UK and the distribution diagram of simulated Poisson base stations, respectively. figure 1 The area is 1964m*1000m, and there are 9 macro base stations and 43 femto base stations in the area. figure 2 The area is 1000m*1000m, and there are 7 macro base stations and 34 femto base stations in the area. The transmit power of the macro base station is 1000 times that of the femto base station; image 3 , attached Figure 4 When the above two base stations are distributed, the cell coverage calculated by this method varies with the threshold The change curve of , the calculated capacity of the two cells is 1.3868 bit/s/Hz/km 2 and 2.9391bit/s/Hz/km 2.

PUM

no PUM

Description & Claims & Application Information

We can also present the details of the Description, Claims and Application information to help users get a comprehensive understanding of the technical details of the patent, such as background art, summary of invention, brief description of drawings, description of embodiments, and other original content. On the other hand, users can also determine the specific scope of protection of the technology through the list of claims; as well as understand the changes in the life cycle of the technology with the presentation of the patent timeline. Login to view more.

Similar technology patents

Powder metallurgy start chainwheel and gear

Owner:ZAOZHUANG RUNYUAN POWDER METALLURGY

Classification and recommendation of technical efficacy words

Why Eureka
Try Eureka