
Three-dimensional rock core visualization method based on CT images

A core and three-dimensional technology, applied in the field of three-dimensional core visualization based on CT images, can solve problems such as data redundancy, opacity calculation redundancy, and affecting algorithm operation efficiency, and achieve the effects of improving work efficiency, saving time and economic costs

Inactive Publication Date: 2014-08-06
CHINA UNIV OF PETROLEUM (EAST CHINA)
View PDF2 Cites 33 Cited by
  • Summary
  • Abstract
  • Description
  • Claims
  • Application Information

AI Technical Summary

Problems solved by technology

[0009] 1. Poor image quality: Since the ray-casting algorithm does not perform any operation of constructing intermediate voxels after mapping the image into 3D volume data, the ray-casting algorithm only reconstructs and displays the image in perspective form under 3D conditions. in the screen
When the image has quality problems such as blurring, brightening or darkening, the effect of algorithmic realization will also be affected
[0010] 2. Volume data redundancy: There are a large number of two-dimensional fault sequence images of the core. In the process of constructing a three-dimensional data field, the volume data obtained by sampling is huge, and there are cases where the difference between several adjacent images is small or almost no difference , the conventional algorithm uses all images for 3D reconstruction of the data volume, which will generate a large amount of data redundancy
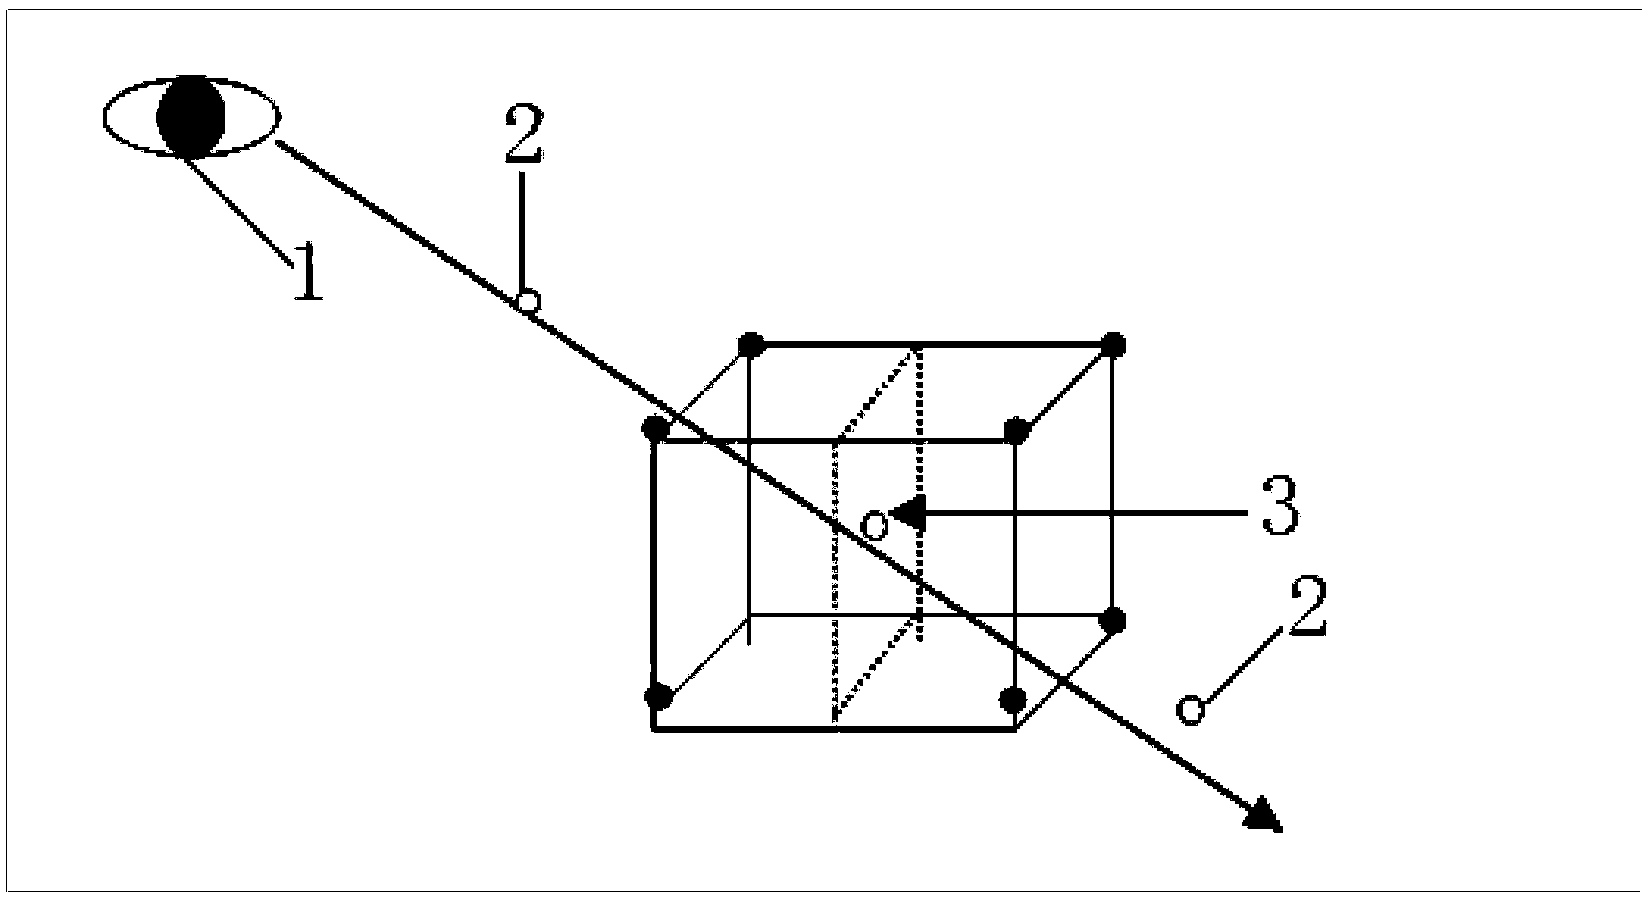
[0011] 3. Opacity calculation redundancy: In general, the ray casting algorithm uses the three-dimensional volume data field as a whole for image synthesis calculation
At this time, the interpolation calculation for the remaining resampling points along this ray direction is redundant, which will affect the operating efficiency of the algorithm to a certain extent

Method used


Image

  • Three-dimensional rock core visualization method based on CT images
  • Three-dimensional rock core visualization method based on CT images
  • Three-dimensional rock core visualization method based on CT images

Examples


Embodiment Construction

[0046] The present invention will be further described in detail below in conjunction with the accompanying drawings and specific embodiments.

[0047] 1. Image acquisition

[0048] At present, the method for obtaining two-dimensional sequence image data is mainly X-ray CT tomography, which scans and makes core images by desktop CT machines through core CT experiments; when X-rays pass through the core samples, X-rays will generate A certain degree of attenuation satisfies the X-ray attenuation formula; the formula is as follows:

[0049] I=I 0 e -Σμx (1)

[0050] Among them, I 0 Represents the initial intensity value of X-rays, I represents the intensity value after X-ray attenuation, μ represents the attenuation coefficient of X-rays; x represents the length on the current path of X-rays; the imaging principle of tomography (CT) is also based on this Established;

[0051] The images acquired through the core CT experiment scanning are not the two-dimensional core sequ...


PUM


Abstract

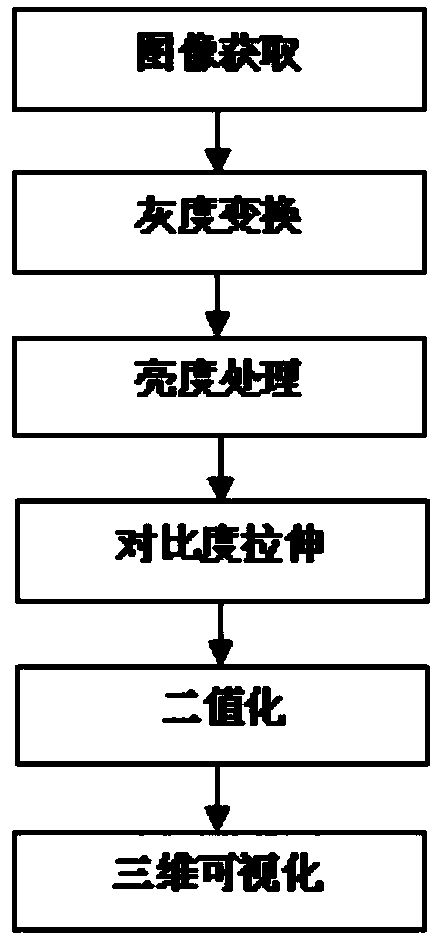
The invention discloses a three-dimensional rock core visualization method based on CT images. The method includes the steps of image obtaining, grey scale transformation, brightness processing, contrast ratio stretching, binarization and three-dimensional visualization. Through the method, three-dimensional rock core visualization based on the CT images is achieved, geological information of a rock core such as pore morphology and distribution, rock types and microstructures can be visually observed. Compared with the traditional method that slices of a casting body are obtained and cross-section analysis is directly conducted on a three-dimensional rock core entity, the three-dimensional rock core visualization method based on the CT images has the advantages that cracks and pore distribution status of the rock core can be observed on the condition of not changing the morphology and internal structure of the rock core, so that a large amount of modeling time and economical cost are saved, the working efficiency is improved, and researchers can conduct various rock core simulation experiments and analysis on the rock core more visually and conveniently.

Description

technical field [0001] The invention relates to a three-dimensional rock core visualization method, in particular to a three-dimensional rock core visualization method based on CT pictures. Background technique [0002] The core is the most intuitive and reliable first-hand information reflecting the geological characteristics of the subsurface. By means of core analysis, researchers can deeply study the rock properties such as lithology, physical properties, electrical properties, and oil and gas properties of the formation encountered, ascertain the data required in the development process, check the development effect, and provide geological information for production stimulation measures. in accordance with. Since the 1980s, with the emergence and gradual development of computerized tomography (CT) technology, the core can be observed and analyzed by obtaining two-dimensional core fault sequence images through CT technology without damaging the core. With the improveme...

Claims


Application Information

Patent Timeline
IPC IPC(8): G06T17/00
Inventor 刘善伟万剑华刘馨泽卜雪娜曾喆王强田俊林
Owner CHINA UNIV OF PETROLEUM (EAST CHINA)
Learn More