Unlock instant, AI-driven research and patent intelligence for your innovation.

A graphical display method of power grid maintenance work intensity based on gis technology

A technology of graphical display and work intensity, applied in the field of power grid GIS, can solve the problems that the work intensity of the power grid maintenance plan cannot be displayed intuitively, and it is unfavorable for statistical analysis, so as to avoid waste of resources and even power outage accidents.

Inactive Publication Date: 2017-12-01
STATE GRID CORP OF CHINA +1
View PDF4 Cites 0 Cited by
  • Summary
  • Abstract
  • Description
  • Claims
  • Application Information

AI Technical Summary

Problems solved by technology

[0004] The purpose of the present invention is to provide a graphical display method of power grid maintenance work intensity based on GIS technology, so as to solve the defects that the work intensity of power grid maintenance plan in the power system cannot be displayed intuitively and is not conducive to statistical analysis

Method used


Image

  • A graphical display method of power grid maintenance work intensity based on gis technology

Examples


Embodiment Construction

[0017] The present invention will be further described below in conjunction with the accompanying drawings and specific embodiments.

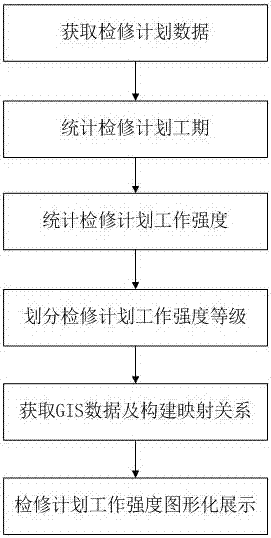
[0018] Such as figure 1 As shown, a GIS technology-based graphical display method for power grid maintenance work intensity includes the following steps:

[0019] S1. Obtain maintenance plan data

[0020] Obtain annual, monthly, weekly and daily maintenance planning data from the smart grid dispatching technical support system of the power system.

[0021] S2. Statistical maintenance plan duration

[0022] Taking power grid equipment as the unit, screen and classify the annual, monthly, weekly, and daily maintenance plan data, and calculate the equipment maintenance period under various periodic maintenance plans.

[0023] S3. Statistical maintenance plan work intensity

[0024] Comprehensively consider the voltage level and equipment type, formulate the equipment maintenance work intensity coefficient plan, quantify the equipment maintenan...


PUM


Abstract

The invention provides a power network overhaul work intensity graphical display method based on a GIS (geographic information system) technology. The method comprises the following steps that overhaul plan data is obtained; an overhaul plan construction period is counted; the overhaul plan work intensity is counted; the overhaul plan work intensity is subjected to grade defining; GIS data is obtained, and a mapping relationship is established; the overhaul plan work intensity is subjected to graphical display. The method has the advantages that the defects that in a power system, the power network overhaul work intensity cannot be intuitively displayed, and the condition is unfavorable for statistical analysis are overcome, the GIS graphical mode is used for intuitively displaying the power network overhaul work intensity, the integral overall planning and the reasonable arranging can be easily realized, and the resource waste or even the power failure accidents due to thoughtless consideration on the overhaul arranging work can be avoided.

Description

technical field [0001] The invention relates to the technical field of power grid GIS, in particular to a graphical display method for power grid maintenance work intensity based on GIS technology. Background technique [0002] The power system implements a strategy based on planned maintenance, and the arrangement of power grid maintenance plans plays a pivotal role in system operation and management. With the development of the power system, the structure of the power grid is becoming more and more complex, and the number of power supply and transmission and transformation equipment is increasing. The manual maintenance plan is often not fully considered, and there is blindness, which may easily lead to waste of resources and even power outages. Therefore, it is an important measure to control the risk of the power grid, ensure the safety of the system and the power supply of users by reasonably arranging the equipment maintenance plan and doing a good job in the comprehen...

Claims


Application Information

Patent Timeline
Patent Type & Authority Patents(China)
IPC IPC(8): G06Q50/06G06Q10/06
CPCG06Q10/0631G06Q50/06Y04S10/50
Inventor 刘辉胡晓飞汤伟刘路登杨铖胡世骏孙向东
Owner STATE GRID CORP OF CHINA