Method and system for realizing regional analysis chart

An implementation method and technology for implementing a system, applied in the WEB field, can solve the problems of slow map rendering, data delay, large browser page caching, etc., and achieve the effect of fast rendering, improving efficiency and saving cache.

Active Publication Date: 2016-02-03
SHENZHEN ZTE NETVIEW TECH
View PDF4 Cites 4 Cited by
  • Summary
  • Abstract
  • Description
  • Claims
  • Application Information

AI Technical Summary

Problems solved by technology

[0004] Although the above-mentioned existing method obtains the final regional analysis map, due to the large amount of regional plane data in the geographic database, it takes up a large browser page cac

Method used


Image

  • Method and system for realizing regional analysis chart
  • Method and system for realizing regional analysis chart
  • Method and system for realizing regional analysis chart

Examples


Embodiment Construction

[0036] The technical scheme of the present invention will be described in further detail below in conjunction with the accompanying drawings and specific examples, so that those skilled in the art can better understand the present invention and implement it, but the examples given are not intended to limit the present invention .

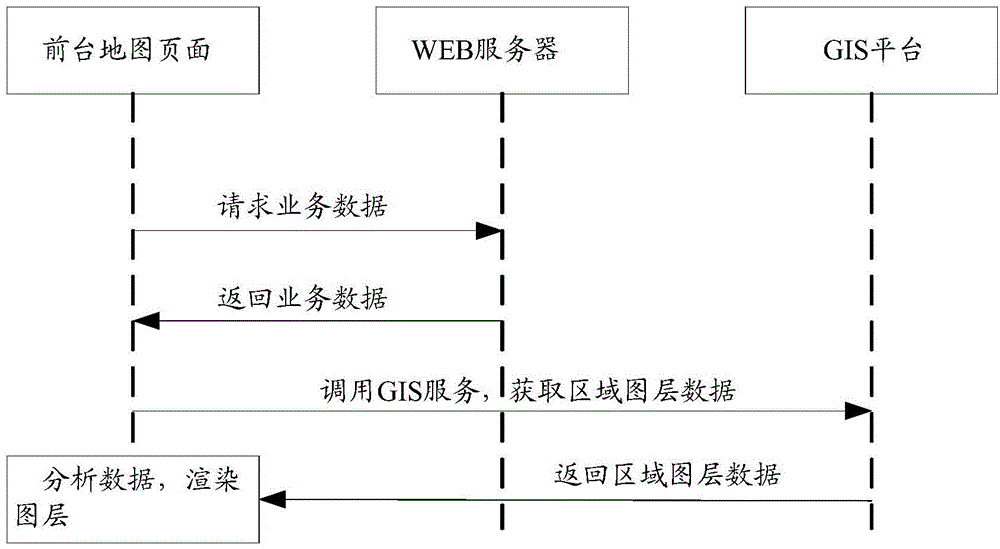
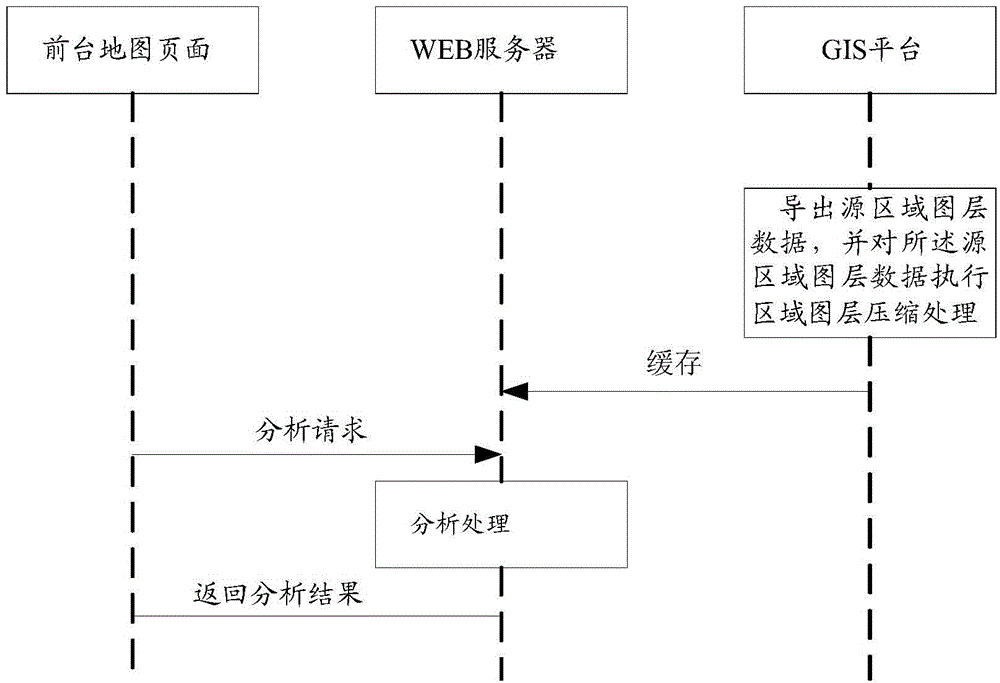
[0037] like figure 2 As shown, a method for realizing an area analysis diagram provided by an embodiment of the present invention includes steps:

[0038] S10. Export the source area layer data on the GIS platform, and perform area layer compression processing on the source area layer data, and then cache it to the WEB server;

[0039] S20. The WEB server obtains the analysis request sent by the front map page, and accordingly obtains the regional layer data and the business data corresponding to each region from the cache;

[0040] S30, the foreground map page determines the chromaticity value of each area according to the business data of each ...


PUM


Abstract

The invention discloses a method and a system for realizing a regional analysis chart. The method comprises the following steps that source regional layer data is exported at a GIS (Geographic Information System) platform, and the source regional layer data is cached to a WEB server after executing regional layer compression processing to the source regional layer data; the WEB server obtains an analysis request sent by a foreground map page and obtains region layer data and business data corresponding to each region from the cache; the foreground map page determines a chromatic value of each region according to the business data of each region and at least one chromaticity determining rule, calls an API (Application Programming Interface) and the source regional layer data of the GIS platform to generate a regional surface, and renders the regional surface according to the corresponding chromatic value to generate the regional analysis chart. By adopting the method and the system, the efficiency for regional analysis can be improved, the cache of the foreground map page is saved, and an effect of rapidly rendering to generate the regional analysis chart (such as a four-color image) is realized.

Description

technical field [0001] The present invention relates to the field of WEB technology, in particular to a method and system for realizing an area analysis diagram based on a network geographic information system WEB-GIS. Background technique [0002] WEB-GIS system is an application system that analyzes and presents geographic data and business data on a map in the form of WEB. In specific applications, it extracts geographic data by invoking the services of the GIS platform and combines it with business data. Correlation analysis, such as correlating it with the population, case frequency, temperature difference, business development, etc. in each geographic administrative area, and finally visually display the analysis results on the map in the form of a regional four-color map . [0003] like figure 1 As shown, the existing regional analysis map implementation method is to call the GIS platform service on the front end of the browser and obtain the regional layer data fro...

Claims


Application Information

Patent Timeline
IPC IPC(8): H04L29/08
Inventor 费晓家袁多利
Owner SHENZHEN ZTE NETVIEW TECH
Why Eureka
Try Eureka