Power grid stability margin visualized display method based GIS

A technology of stability margin and display method, applied in electrical components, circuit devices, AC network circuits, etc., can solve problems such as changes, different power angle stability thresholds, and unknown node power angle thresholds.

Active Publication Date: 2016-06-08
STATE GRID HEBEI ELECTRIC POWER RES INST +2
View PDF5 Cites 9 Cited by
  • Summary
  • Abstract
  • Description
  • Claims
  • Application Information

AI Technical Summary

Problems solved by technology

However, due to the complexity of the multi-machine system, the critical value of power angle stability of each node is not the same, and it will also change with the change of the system operation mode
The dispatcher can "see" the power angle value of each node, but does not know the power angle critical value of the node, and does not know how far the current operating point is from the stable boundary

Method used


Image

  • Power grid stability margin visualized display method based GIS
  • Power grid stability margin visualized display method based GIS
  • Power grid stability margin visualized display method based GIS

Examples


Embodiment Construction

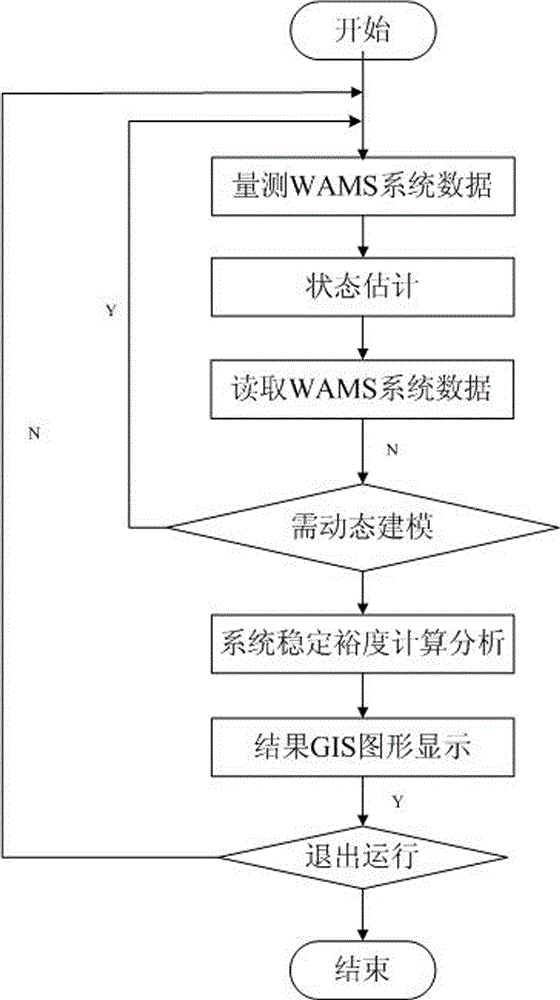
[0074] The following is based on Figure 1-19 And embodiment further illustrate the present invention.

[0075] 1. State estimation for WAMS data:

[0076] The function of power system state estimation is to estimate the current operating state of the power system based on various measurement information of the power system. Power system state estimation can be said to be the basis of most advanced software for online applications. If the power system state estimation result is inaccurate, any subsequent analysis and calculation will not be able to obtain accurate results. There are two types of power system measurement: telemetry and telesignaling. Telemetry is the measurement result of analog quantities, including branch power or current, node voltage, etc.

[0077] The main purpose of carrying out power system state estimation in the present invention is:

[0078] 1. Eliminate bad data that may exist in power system remote signaling or telemetry. Due to various reason...


PUM


Abstract

The invention discloses a power grid stability margin visualized display method based a GIS. The method comprises the following steps of: obtaining measurement data of an electric power system wide area measurement system; carrying out state estimation on the measurement data of the electric power system wide area measurement system; directly reading data after state estimation correction; carrying out dynamic modeling according the data after the state estimation correction; and carrying out visualized display on a critical stable value and a stability margin of an equivalent electric power system. The power grid stability margin visualized display method has the advantages that equivalence processing on whole network data or on data outside the research range in the stability margin calculating process is omitted, the calculating time and resources are saved, and a huge economic benefit is generated. The regional stability margin is displayed in a geographical information map mode, the angle of stability condition display and judging is expanded from point and line to plane, so that people can globally grasp the stability condition of the electric power system more visually and effectively, better learning and application of control personnel are facilitated, and the stable operation of the electric power system is ensured.

Description

technical field [0001] The invention belongs to the technical field of power system stability margin analysis, and relates to a GIS-based visualization display method of power grid stability margin. Background technique [0002] Under the premise of establishing a "unified and strong smart grid" proposed by the state, the stability of the power system has attracted more attention. Power system stability is the ability of the power system to maintain stable operation after being disturbed. Due to the objective existence of interference and the unpredictability of interference, maintaining the stability of the power system has become one of the most important tasks for the safe operation of the power system. The system dispatcher must keep the system running in the stable region at all times. However, due to limited conditions, the current dispatchers cannot directly observe the stability of the system when they are on duty. Determine the stability of the system. Due to the...

Claims


Application Information

Patent Timeline
Patent Type & Authority Applications(China)
IPC IPC(8): H02J3/00H02J13/00G06F17/50
CPCG06F30/367H02J3/00H02J13/00001H02J2203/20Y04S10/40
Inventor 侯磊范辉赵鸣田霖刘杰李士林
Owner STATE GRID HEBEI ELECTRIC POWER RES INST
Why Eureka
Try Eureka