Method and system for hotspot module instruction tracking

A module instruction and hotspot technology, applied in the fields of instrumentation, electrical digital data processing, computing, etc., can solve the problem that the debugger cannot trace the full instruction of the memory page, cannot handle the execution of the system instruction, and the performance overhead of single-step tracing is high, so as to avoid Incompleteness and complexity issues, avoiding inefficiencies, ensuring completeness

Inactive Publication Date: 2016-06-29
国家信息技术安全研究中心
View PDF4 Cites 13 Cited by
  • Summary
  • Abstract
  • Description
  • Claims
  • Application Information

AI Technical Summary

Problems solved by technology

[0004] Ordinary debuggers cannot perform full instruction tracing on the specified memory page. Single-step tracing can better trace thread instructions, but it still cannot handle the execution of instructions triggered by system callbacks. The performance overhead of single-step tracing is also very large; breakpoints Tracing can better solve the performance overhead, but the setting overhead of breakpoints is very high, and it also cannot handle the execution of instructions triggered by system callbacks, so breakpoint tracing often only uses the tracing of a limited number of instructions

Method used


Image

  • Method and system for hotspot module instruction tracking
  • Method and system for hotspot module instruction tracking
  • Method and system for hotspot module instruction tracking

Examples


Embodiment 1

[0027] A method for hot module instruction tracking, comprising the following steps:

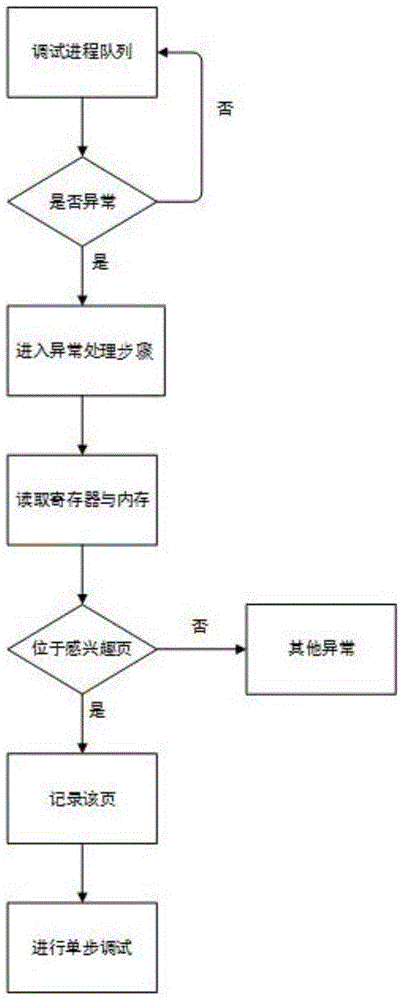
[0028] Debug loop steps: After a process becomes the debugged process, it will send a notification to the debugger when it completes certain operations or an exception occurs, and then suspends itself until the debugger commands it to continue execution;

[0029] Exception handling steps: Through the distribution of exceptions, different exception events are processed. Exception handling separates receiving and processing error codes. It is a mechanism in programming languages ​​or computer hardware to handle exceptions that occur in software or information systems. conditions (that is, some special conditions beyond the normal execution flow of the program);

[0030] Read registers and memory steps: Threads have a context, which contains most of the information about the thread, such as the address of the thread stack, the address of the instruction that the thread is currently executing, a...

Embodiment 2

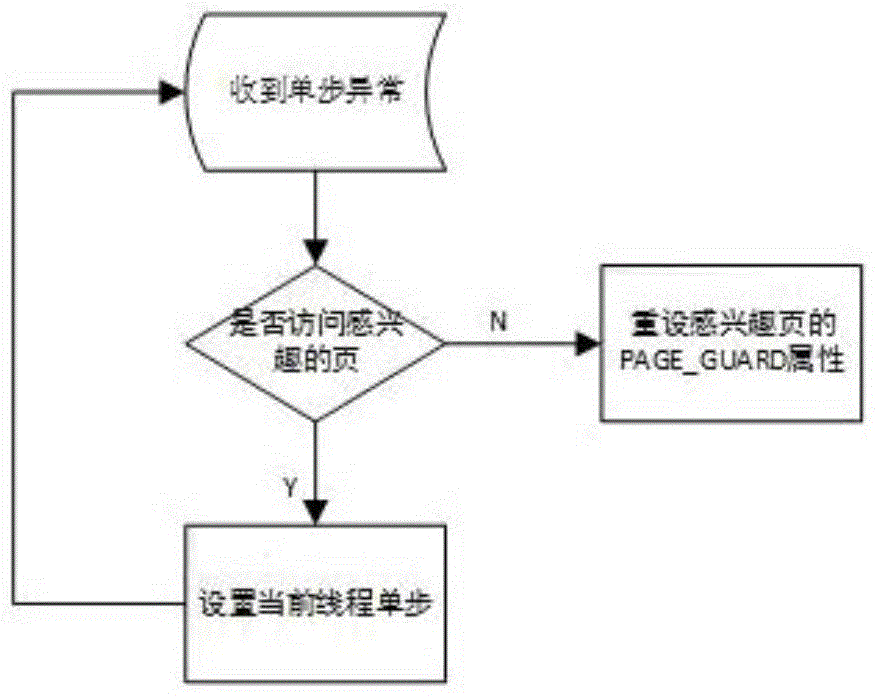
[0035] A method for tracking instructions for hot modules. After single-step debugging, the PAGE_GUARD attribute of the hot module will be lost, and the page number of the missing PAGE_GUARD attribute will be added to a linked list. When the thread of single-step debugging is judged not to access the hot module , will re-add the PAGE_GUARD attribute of the hotspot module according to the linked list, and directly execute this thread in a non-single-step manner; this method mainly includes the following steps:

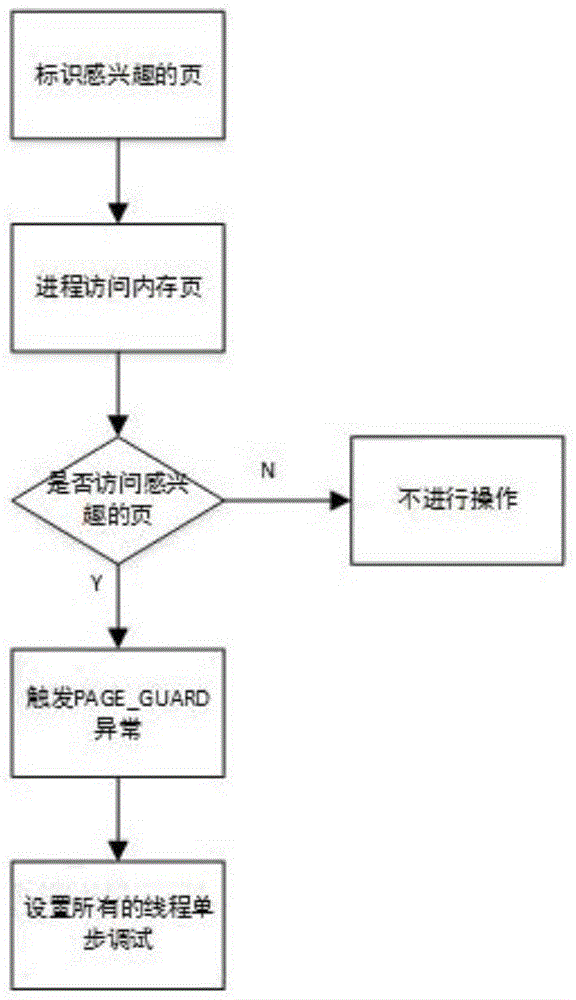
[0036] S1: Identify the pages of interest: set the PAGE_GUARD attribute for the code page where the hotspot module is located, and identify the PAGE_GUARD attribute of these pages;

[0037]S2: Process access memory page: The debugged process accesses the memory page at runtime, because the interested page has been set with the PAGE_GUARD attribute, once the thread accesses the memory page marked as interested, an exception will be triggered, and the main program will Su...

Embodiment 3

[0042] For Windows 7 system of Microsoft Corporation

[0043] The debugger developed based on hotspot module tracking will be debugged under Windows7 system. Use visualstdio2013 to compile and run the project.

[0044] The debugger project can specify an exe execution file, and select a memory page that may be maliciously attacked as the PAGE_GUARD attribute, and then the debugger generates a process, which is designated as the debugged process. Once the debugged process reads the hotspot module Writing will trigger a PAGE_GUARD exception. The debugged process will trigger many exceptions in its life cycle. According to the debugger process receiving the exception event sent by the debugged process and handling the exception, a debugging process is completed. Table 1 lists the debugger Exception events that may be triggered.

[0045] Table 1 Abnormalities that may be triggered by this implementation

[0046]

[0047]

[0048]

[0049] 1. Debugging events and debug...


PUM


Abstract

A method and system for hot module instruction tracking, belonging to the technical field of software analysis. First mark the hotspot module, that is, the page that the user is interested in; when the thread accesses the page that the user is interested in, it will trigger the PAGE_GUARD exception, thereby triggering the debugger to process; then set all the threads to single-step debugging through the debugger, and put the The page number of the page is added to the recovery linked list, because the page that has triggered the PAGE_GUARD exception will automatically lose the PAGE_GUARD attribute, so as to ensure the integrity of instruction tracking in the multi-thread environment and kernel callback environment; finally, analyze whether the address of the execution instruction is located in the current execution thread Located on the page of interest, if so, continue single-step debugging, otherwise, do not operate on the thread, and reset the PAGE_GUARD attribute of the page of interest according to the previously used linked list.

Description

technical field [0001] The invention relates to a method and a system for tracking hotspot module instructions, belonging to the technical field of software analysis. Background technique [0002] The debugger has existed since the birth of the computer. The initial debuggers are directly implemented based on hardware. The working principle of the debugger is based on the exception mechanism of the central processing unit, and is distributed by the operating system's exception distribution / event distribution subsystem. (or module) is responsible for encapsulating and processing it, and interacting with the debugger in a friendly manner in real time. Debugging is the most important, direct, and indispensable mechanism for software maintenance and error correction. [0003] The most basic functions of the debugger include controlling the running of the software, viewing the information during the running of the software, and modifying the execution flow of the software. Contr...

Claims


Application Information

Patent Timeline
Patent Type & Authority Applications(China)
IPC IPC(8): G06F11/36
CPCG06F11/3636G06F11/3612G06F11/3644
Inventor 万仁忠王东王少杰白金李冰宋珺王宏梁利王派李蒙李霞曹越徐茜陈琳
Owner 国家信息技术安全研究中心
Why Eureka
Try Eureka