Gas concentration calibration method for gas sensor

A technology of gas sensor and calibration method, which is applied in the field of sensors, can solve problems such as errors, and achieve the effect of improving sensitivity and obvious linear relationship

Inactive Publication Date: 2016-07-27
UNIV OF ELECTRONICS SCI & TECH OF CHINA
View PDF9 Cites 15 Cited by
  • Summary
  • Abstract
  • Description
  • Claims
  • Application Information

AI Technical Summary

Problems solved by technology

[0009] The purpose of the present invention is to: provide a simple, accurate, objective and fast gas concentration calibration method applied to gas sensors, solve the error problem caused by artificially determining the data range in conventional methods, and avoid subjectivity; the present invention is based on differential extreme values Compared with other models, the gas concentration calibration method is more reasonable, and the operation is simple and easy

Method used


Image

  • Gas concentration calibration method for gas sensor
  • Gas concentration calibration method for gas sensor
  • Gas concentration calibration method for gas sensor

Examples


Embodiment 1

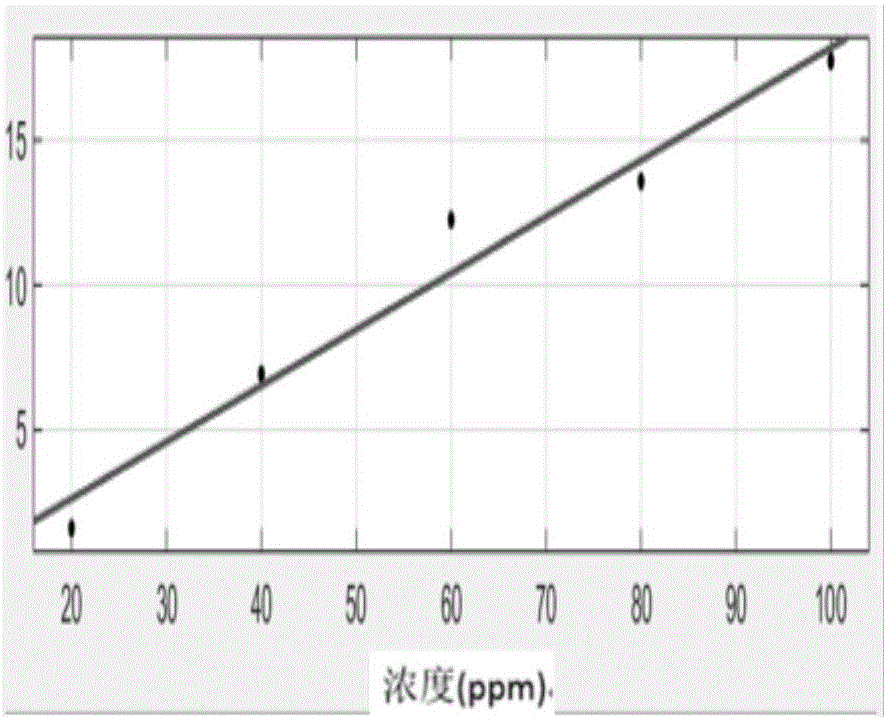
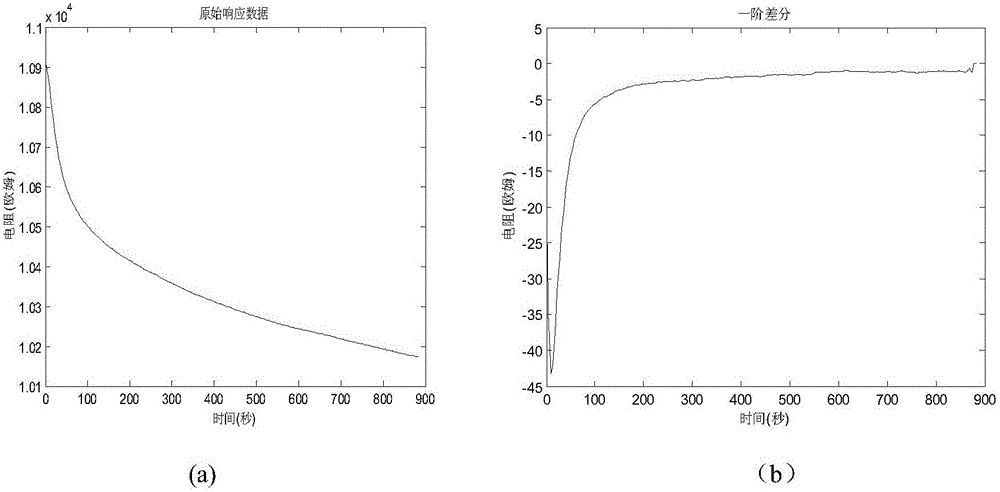
[0032] Step 1: Test ammonia (NH 3 ) data, with 500ppm dry air as the base gas; 20ppm ammonia gas (NH 3 ) as the detection gas, the collection time interval is 4 seconds, and a set of response data [R 1 , R 2 ,...,R n ], the data here is the test resistance value after passing through the ammonia gas;

[0033] Step 2: For the data obtained in step 1 [y 1 ,y 2 ,...,y n ]=[R 1 , R 2 ,...,R n ] for the following processing:

[0034] (1) Find the first-order difference: Δy i =y i+1 -y i ;

[0035] (2) Find the extreme value of the first-order difference;

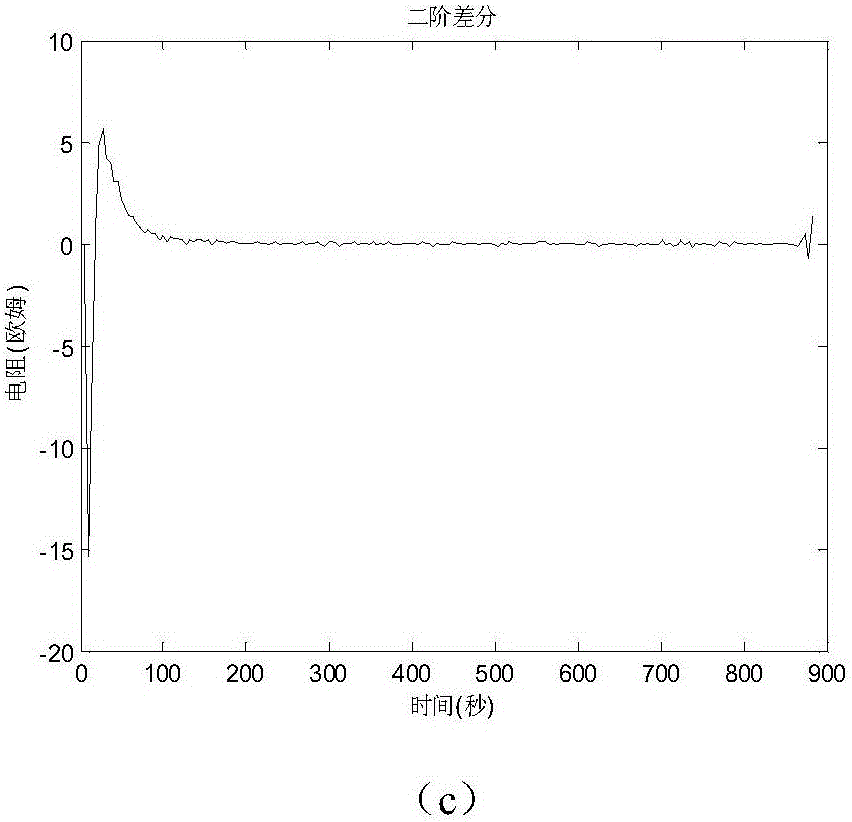
[0036] (3) Find the second order difference: Δ 2 the y i =Δy i+1 -Δy i =(y i+2 -yi+1)-(y i+1 -y i )=y i+2 -2y i+1 +y i ;

[0037] (4) Find the two extreme values ​​of the second order difference;

[0038] Step 3: Change the concentration of the incoming detection gas to 40ppm, 60ppm, 80ppm, and 100ppm in sequence, and repeat steps 1 and 2 to obtain another four sets of data. The minimum value of the seco...

Embodiment 2

[0041] Step 1: Test nitrogen dioxide (NO 2) data, with 500ppm dry nitrogen as the base gas; 20ppm nitrogen dioxide (NO 2 ) as the detection gas, the collection time interval is 1 second, and a set of response data [R 1 , R 2 ,...,R n ], where the data is the test resistance value after nitrogen dioxide is introduced;

[0042] Step 2: For the data obtained in step 1 [y 1 ,y 2 ,...,y n ]=[R 1 , R 2 ,...,R n ] for the following processing:

[0043] (1) Find the first-order difference: Δy i =y i+1 -y i ;

[0044] (2) Find the extreme value of the first-order difference;

[0045] (3) Find the second order difference: Δ 2 the y i =Δy i+1 -Δy i =(y i+2 -yi+1)-(yi+1-y i )=y i+2 -2y i+1 +y i ;

[0046] (4) Find the two extreme values ​​of the second order difference;

[0047] Step 3: Change the concentration of the incoming detection gas to 40ppm, 60ppm, 80ppm, and 100ppm in sequence, and repeat steps 1 and 2 to obtain another four sets of data. The minimum val...

Embodiment 3

[0049] Step 1: Test nitrogen dioxide (NO 2 ) data, with 500ppm dry nitrogen as the base gas; 20ppm nitrogen dioxide (NO 2 ) as the detection gas, the collection time interval is 2 seconds, and a set of response data [R 1 , R 2 ,...,R n ], where the data is the test resistance value after nitrogen dioxide is introduced;

[0050] Step 2: For the data obtained in step 1 [y 1 ,y 2 ,...,y n ]=[R 1 , R 2 ,...,R n ] for the following processing:

[0051] (1) Find the first-order difference: Δy i =yi+1-y i ;

[0052] (2) Find the extreme value of the first-order difference;

[0053] (3) Find the second order difference: Δ 2 the y i =Δy i+1 -Δy i =(y i+2 -yi+1)-(y i+1 -y i )=y i+2 -2y i+1 +y i ;

[0054] (4) Find the two extreme values ​​of the second order difference;

[0055] Step 3: Change the concentration of the incoming detection gas to 40ppm, 60ppm, 80ppm, and 100ppm in sequence, and repeat steps 1 and 2 to obtain another four sets of data. The minimum v...


PUM


Abstract

The invention discloses a gas concentration calibration method for a gas sensor, belonging to the technical field of gas sensors. According to the gas concentration calibration method, the operation is simple, that is, a calibration value can be obtained by calculating a first-order difference extreme value and a second-order difference extreme value from response data acquired under different gas concentrations or converting the first-order difference extreme value and the second-order difference extreme value, a scatter diagram is obtained by taking the calibration value as a vertical coordinate and the detected gas concentration as a horizontal coordinate, a calibration curve graph is obtained by carrying out linear fitting on the scatter diagram, and the gas concentration can be judged according to the calibration curve graph. By virtue of the gas concentration calibration method, the detection speed is very high, and the detection sensitivity and accuracy are improved; a detection result is relatively objective, the range of the response data does not need to be manually determined in the concentration detection, and the concentration detection is not influenced by subjective factors and data volumes; the gas concentration calibration method is not influenced by a parameter estimation algorithm; the linear relation between the processed calibration value and the gas concentration is relatively obvious, so that the concentration detection is facilitated.

Description

technical field [0001] The invention belongs to the technical field of sensors, and in particular relates to a gas concentration calibration method for rapid detection of gas sensors. Background technique [0002] The gas sensor is the core of the gas detection system and is a device that converts the volume fraction of gas into a corresponding electrical signal. Gas sensors rely on surface adsorption or reaction when interacting with gas, which causes changes in the conductivity, mass or other characteristics of the sensor, thereby detecting the concentration of the measured gas. [0003] At present, the detection data of gas concentration is generally processed according to the "response". Response time is defined as: when the test gas is injected, the time required for the change in the test value to reach 90% of its total change, recovery time is defined as: when the test gas is removed from the test environment, the test value returns to the total change 10% of the ti...

Claims


Application Information

Patent Timeline
Patent Type & Authority Applications(China)
IPC IPC(8): G01N27/12
CPCG01N27/12
Inventor 杜鸿飞谢光忠马行方苏元捷张秋平太惠玲杜晓松
Owner UNIV OF ELECTRONICS SCI & TECH OF CHINA
Why Eureka
Try Eureka