Pulse baseline value calculation method and particle counting method for blood cell analyzer

A technology of pulse baseline and calculation method, which is applied in the fields of calculation, analysis of materials, individual particle analysis, etc., can solve the problem that it is difficult to avoid noise interference in baseline value calculation, and achieve the effect of reducing misjudgment and accurate particle counting.

Active Publication Date: 2016-08-17
ACON BIOTECH (HANGZHOU) CO LTD
View PDF11 Cites 10 Cited by
  • Summary
  • Abstract
  • Description
  • Claims
  • Application Information

AI Technical Summary

Problems solved by technology

[0004] The technical problem to be solved by the present invention is to provide a pulse baseline value calculation method and a particle counting method for a blood cell analyzer in view of the above-mentioned problems in the prior art that the calculation of the baseline value is difficult to avoid noise interference

Method used


Image

  • Pulse baseline value calculation method and particle counting method for blood cell analyzer
  • Pulse baseline value calculation method and particle counting method for blood cell analyzer
  • Pulse baseline value calculation method and particle counting method for blood cell analyzer

Examples


Embodiment 1

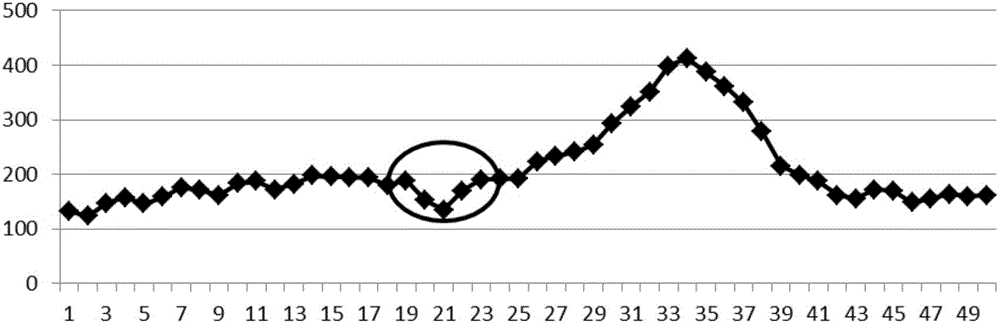
[0078] figure 2 It is a voltage curve graph with downward interference during the platelet detection process, where the abscissa is the number of sampled data, the ordinate is the measured voltage amplitude, and the pulse peak x 34 The size of 413, table 1 is figure 2 Sample data x in 1 -x 50 The specific value of , the data includes the sampling data in the non-duration period of the pulse and the sampling data in the duration of the pulse. Let's take the specific sampling data as an example, with the value of n being 8, the baseline threshold being 20, and the data x 22 is the starting point of the pulse, indicating the calculation steps of the pulse baseline value:

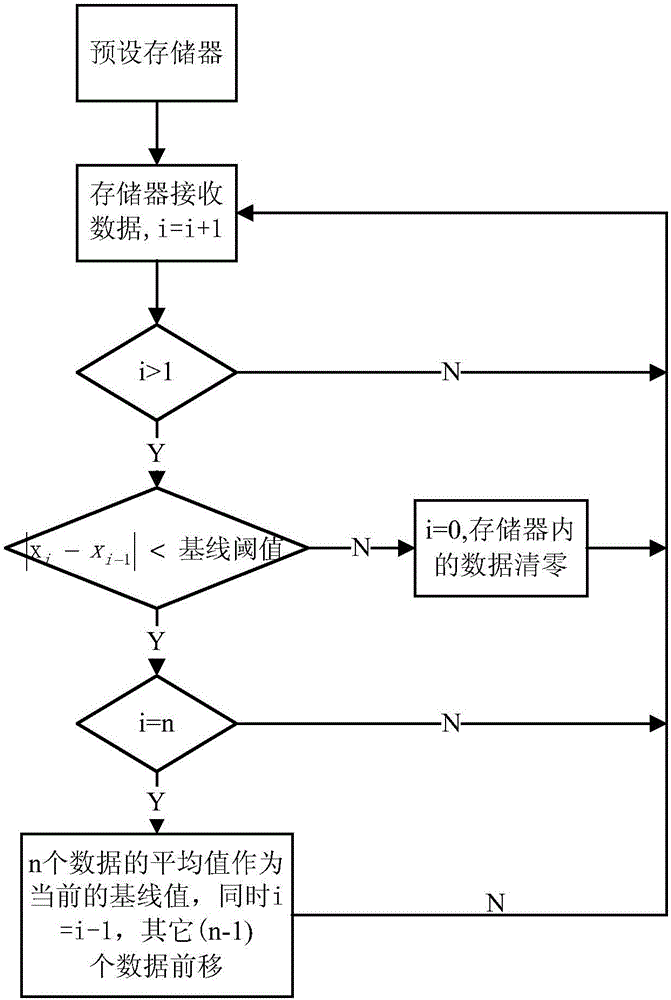
[0079] 1) Preset memory, the memory is used to store 8 continuous sampling data;

[0080] 2) During the non-duration of the pulse, the memory receives the sampling data x 1 , the value i of the data stored in the memory is accumulated by 1, that is, i=1, i<1;

[0081] 3) The memory receives the samplin...

Embodiment 2

[0111] Figure 4 It is a voltage curve graph with upward interference during the red blood cell detection process, where the abscissa is the number of sampled data, the ordinate is the measured voltage amplitude, and the pulse peak x 36 The size of is 1314, the value of n is 8, the baseline threshold is 20, and the data x 23 Calculated for pulse start. Table 3 is Figure 4 Sample data x in 1 -x 50 The specific value of , the data includes the sampling data in the non-duration period of the pulse and the sampling data in the duration of the pulse. By calculation, the data range of the sampled data is obtained in x 10 to x 17 satisfies the requirements for calculating the baseline value, therefore, x 10 to x 17 The average value of the 8 data in 238.12 is the baseline value of the current pulse.

[0112] sequence

x 1 -x 10

x 11 -x 20

x 21 -x 30

x 31 -x 40

x 41 -x 50

1

183

237

262

599

525

2

1...

Embodiment 3

[0132] Figure 6 It is a voltage curve graph with downward interference during the red blood cell detection process, where the abscissa is the number of sampled data, the ordinate is the voltage amplitude, and the pulse peak x 32 The size of 884, Table 5 is Figure 6 Sample data x in 1 -x 45 The specific value of , the data includes the sampling data in the non-duration period of the pulse and the sampling data in the duration of the pulse. Taking the specific sampling data as an example, the value of w is 7, and the starting point threshold is 40 for calculation to illustrate the calculation steps of the pulse starting point:

[0133] 1) A memory is provided, and the memory is used to store 8 continuous sampling data;

[0134] 2) The memory receives and stores the sampling data y 1 =x 1 =121, the value j of stored data in the memory is accumulated by 1, i.e. j=1;

[0135] 3) The memory receives data y 2 =x 2 = 112, j = 2, y 2 1 , the memory receives data y 3 =x 3 ...


PUM


Abstract

The invention relates to a pulse baseline value calculation method and a particle counting method for a blood cell analyzer. The pulse baseline value calculation method comprises the step of calculating the average value of n consecutive sampling data on the condition that the absolute value of the difference between two arbitrary adjacent data among the n consecutive sampling data is smaller than a baseline threshold value and the n consecutive sampling data are nearest to a pulse starting point within a pulse non-sustainable period, wherein the average value represents the baseline threshold value. According to the technical scheme of the invention, the baseline threshold value is preset and compared, and the sampling data of a noise-superimposed baseline are avoided. Meanwhile, sampling data within a noise / interference allowable range are selected and calculated. In this way, the noise is accumulated onto a final baseline value, so that the baseline value is more close to real data. The misjudgment of the baseline value is greatly reduced, so that the particle counting result is more accurate. The method can be applied to the particle counting operations of three-category type blood cell analyzers, five-category type blood cell analyzers, flow cytometers and other biochemical instruments.

Description

technical field [0001] The invention relates to the technical field of pulse signal identification, in particular to a pulse baseline value calculation method and a particle counting method for a blood cell analyzer. Background technique [0002] When the blood cell analyzer measures the number of particles such as white blood cells and red blood cells, the blood sample is placed in the particle measurement system. When the measured particles pass through, the sensor will generate a corresponding analog pulse signal, which is converted into Digital pulse signal, the digital pulse signal includes two data states, one is the data during the duration of the pulse, and the other is the data during the non-duration of the pulse. During the measurement, the baseline value, start point, end point, peak value and valley value of the pulse signal are extracted from the pulse signal, and the absolute pulse peak value is obtained by subtracting the baseline value from the extracted pea...

Claims


Application Information

Patent Timeline
Patent Type & Authority Applications(China)
IPC IPC(8): G01N15/10G06F19/10
CPCG16B99/00G01N15/10G01N2015/1006G01N15/12G01R29/02G01D5/2448G01N15/1429G01N15/1459G01N2015/1402G01N2015/1486
Inventor 管海兵徐宇
Owner ACON BIOTECH (HANGZHOU) CO LTD
Why Eureka
Try Eureka