Graph visualization system for power grid power flow analysis

A power flow analysis and graphics technology, applied in electrical digital data processing, CAD circuit design, special data processing applications, etc., can solve the problems of repeated input, unintuitive table recording equipment attribute information, etc., to ensure consistency and correctness, Realize the effect of visualization and easy parameter modification

Inactive Publication Date: 2016-09-14
ELECTRIC POWER RES INST STATE GRID JIBEI ELECTRIC POWER COMPANY +2
View PDF4 Cites 8 Cited by
  • Summary
  • Abstract
  • Description
  • Claims
  • Application Information

AI Technical Summary

Problems solved by technology

This makes the property information of the form recording equipment very unintuitive, and sometimes even repeated entry

Method used


Image

  • Graph visualization system for power grid power flow analysis
  • Graph visualization system for power grid power flow analysis
  • Graph visualization system for power grid power flow analysis

Examples


Embodiment Construction

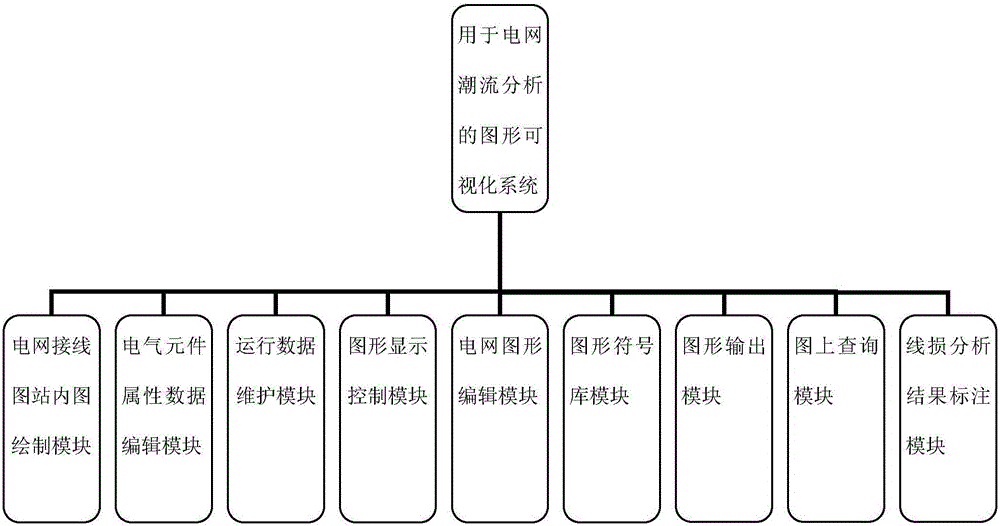
[0023] A graphic visualization system for grid power flow analysis, comprising:

[0024] (1) Power grid wiring diagram station diagram drawing module: provide power grid wiring diagrams of various voltage levels for the graphic visualization system of power grid power flow analysis. Voltage levels include: 500kV, 220kV, 110kV, 66kV, 35kV, 10kV and 0.4kV. Manage electrical equipment and electrical components within the scope of line loss analysis in a graphical manner, form a hierarchical management basic database with grid topology information and electrical component attribute information, and provide basic information for line loss analysis.

[0025] (2) Electrical component attribute data editing module: used to provide attribute editing of electrical components. There are two ways to edit the data of the electrical component attribute data editing module: one is to add a primitive on the graph first, and then click the primitive to enter data in the data entry interface; ...


PUM


Abstract

The present invention relates to a graphical visualization system for power grid power flow analysis, comprising the following modules: a power grid wiring diagram instation diagram drawing module, an electrical element attribute data editing module, an operating data maintenance module, a graph display control module, a power grid graph editing module, a graph symbol library module, a graph output module, an on-graph query module and a line loss analysis result tagging module. According to the graph visualization system, topological information and element parameter information which are conveyed to a computer by a user through a graph editor can be converted into forms convenient for power system module computing program processing, graphical modeling of a power grid is achieved, visualization management can be performed on element parameters, foundation can be further provided for line loss analysis, and visualization of line loss information can be achieved.

Description

technical field [0001] The invention relates to a graph visualization system used for grid power flow analysis in the field of power systems. Background technique [0002] With the development of my country's economic construction and the rapid development of the construction of the national power grid, the management difficulty of the power grid has increased sharply, and there are more and more equipment in the power grid, which makes the modeling of the power grid very complicated. Grid modeling refers to recording the attribute information of all equipment in the grid and the grid graph that connects all equipment. [0003] In the prior art, the power grid modeling generally records the attribute information of the equipment in the form of an equipment table, and the attribute information of the equipment recorded in the table is independent from the graphical interface for connecting all the equipment. This causes the property information of the form to record the equi...

Claims


Application Information

Patent Timeline
Patent Type & Authority Applications(China)
IPC IPC(8): G06F17/50
CPCG06F30/30G06F30/367Y02E60/00
Inventor 范荻刘平苏为民徐正龙李群炬陈宁邓炜王长瑞臧景茹高翔史扬王非金海峰姚谦李长宇赵焱曹天植张雯刘军娜辛光明黄天啸张思琪张硕罗婧郝婧李加顺王顺义孟超
Owner ELECTRIC POWER RES INST STATE GRID JIBEI ELECTRIC POWER COMPANY
Why Eureka
Try Eureka