D-S evidence theory-based textile process data fusion system

A technology of evidence theory and process data, applied in the field of textile data monitoring, can solve the problems of information integration models and methods that are difficult to deal with, the accuracy of data fusion results is difficult to guarantee, and the amount of data is doubled.

Inactive Publication Date: 2016-09-28
XI'AN POLYTECHNIC UNIVERSITY
3 Cites 14 Cited by

AI-Extracted Technical Summary

Problems solved by technology

[0003] In this "big data" environment, the textile manufacturing execution system is a nonlinear, time-varying multivariate system, which makes the production process data often accompanied by unmeasurable uncertainties. As the application accuracy increas...

Method used

Analytical formula (1) and (2), at first, it has satisfied the definition condition of mass function, and when calculating the basic probability distribution of object (comprising Θ) of evidence body (sensor), set up evidence body (sensor) The corresponding relationship between the distance and the correlation with the target (monitoring type), the distribution of the correlation, and the reliability coefficient of the sensor; then, according to the correlation between the evidence body and the target, a weighting coefficient is introduced to output the decision result, effectively Enhanced the correctness of decision-making results.
As shown in Figure 1, the embodiment of the present invention provides a kind of textile process data fusion system based on D-S evidence the...

Abstract

The invention discloses a D-S evidence theory-based textile process data fusion system. The system comprises sensor modules used for acquiring workshop data, local decision-making modules and a D-S synthesis module, wherein the sensor modules and the local decision-making modules are connected in a one-to-one correspondence manner; the local decision-making modules are connected with the D-S synthesis module; each local decision-making module adopts an adaptive weighted data fusion algorithm; and the D-S synthesis module adopts a D-S evidence theory. According to the system, two stages of sensors are adopted for information fusion; the first stage of the sensors are used for local fusion, a classic adaptive weighted fusion estimation algorithm is adopted, and the uncertainty and limitation of a single sensor are overcome, so that consistent explaination and description of a tested object are obtained; the second stage of the sensors are used for global fusion, and a D-S evidence theory is adopted; and the D-S evidence theory allows people to perform modeling on uncertain problems and perform reasoning, so that the uncertainty of things can be reflected more objectively.

Application Domain

Special data processing applicationsInformatics

Technology Topic

Self adaptiveTest object +7

Image

  • D-S evidence theory-based textile process data fusion system
  • D-S evidence theory-based textile process data fusion system
  • D-S evidence theory-based textile process data fusion system

Examples

  • Experimental program(1)

Example Embodiment

[0040] In order to make the objectives and advantages of the present invention clearer, the present invention will be further described in detail below in conjunction with embodiments. It should be understood that the specific embodiments described herein are only used to explain the present invention, but not to limit the present invention.
[0041] Such as figure 1 As shown, the embodiment of the present invention provides a textile process data fusion system based on DS evidence theory, which includes a sensor module, a local decision module, and a DS synthesis module for collecting data from each workshop. The sensor module and the local decision module correspond one to one The local decision-making module is connected to the DS synthesis module. The local decision-making module adopts an adaptive weighted data fusion algorithm, which can not only optimize the data of the equipment sensors in each workshop, but also effectively eliminate environmental interference signals. Its central idea is According to the size of the error of each sensor data, different weights are assigned. For high-precision data, because the error is small, the assigned weight is larger, and vice versa; the DS synthesis module adopts the Dempster-Shafer (DS) evidence theory.
[0042] The adaptive weighted data fusion algorithm specifically includes the following steps:
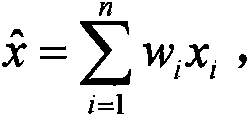
[0043] S1. There are n sensors to detect abnormal events caused by certain uncertain factors, and their variances are respectively The measured value of each sensor is x 1 , X 2 ,..., x n , And they are independent of each other; assuming that the weighting factors of each sensor are w 1 , W 2 ,..., w n , Then after the weighting factor is introduced, the sensor data fusion value of the system is:
[0044] Where The total mean square error is:
[0045] δ 2 = E [ ( x - x ^ ) 2 ] = E X i = 1 n w i 2 ( x - x ^ ) 2 + 2 E X i = 1 , j = 1 , i = j n w i w j ( x - x ^ i ) ( x - x ^ j ) .
[0046] Due to x 1 , X 2 ,..., x n They are independent of each other and are unbiased estimates of x, so:
[0047] And i≠j; i,j=1, 2,...,n.
[0048] Then there are:
[0049] In the formula, δ is each weighting factor w i The multivariate quadratic function of, its minimum value is obtained in the weighting factor w 1 , W 2 ,..., w n Obtain the extreme value of multivariate function under the condition of normalization constraint.
[0050] S2. According to the extreme value theory, when the weighting factor is:
[0051] Then there are:
[0052] The above is an estimation based on the data collection value of each sensor at a certain moment. When the estimated true value x is constant, it can be estimated based on the average value of the historical data of each sensor;
[0053] S3. Let: q = 1, 2,..., n;
[0054] The estimated value at this time is The total mean square error is:
[0055] δ ‾ 2 = E [ ( x - x ‾ ^ ) 2 ] = E X i = 1 n w i 2 ( x - x ‾ i w ) 2 + 2 E X i = 1 , j = 1 , i = j n w i w j ( x - x ‾ i ) ( x - x j w ) .
[0056] Because x 1 , X 2 ,..., x n It is an unbiased estimate, so:
[0057] δ ‾ 2 = E [ X i = 1 n w i 2 ( x - x ‾ j w ) 2 ] = 1 k X i = 1 n w i 2 σ i 2 = σ 2 min k .
[0058] Obviously, And as k increases, δ gradually decreases.
[0059] According to the following definition of D-S evidence theory:
[0060] Definition 1: Let Θ be the recognition frame, if the set function m: 2 Θ →[0,1](2 Θ Is the power set of Θ) satisfies ∑m(A)=1, then m is called the basic reliability distribution on the recognition framework Θ; m(A) is called the basic reliability value of A, and m(A) reflects the reliability of A itself;
[0061] Definition 2: If m is a basic reliability distribution, then The defined function Bel is a reliability function, and Bel(A) reflects the total reliability of all subsets of A;
[0062] If there is A belonging to the recognition framework Θ, define Dou(A)=Bel(A), Pl(A)=1-Bel(A), then call Pl(A) the likelihood function of Bel, call Pl(A) as The plausibility of A describes the plausibility or reliability of A; Dou is the suspicion function of Bel, Dou(A) is the suspicion of A, and describes the degree of uncertainty of A; in fact, [Bel(A ), Pl(A)] represents the uncertainty interval of A, that is, the upper and lower limits of the probability;
[0063] In DS evidence theory, since there is no specific description of the Basic Probability Assignment (BPA) function, under normal circumstances, it mainly depends on experts to specify or obtain the basic probability assignment based on some experience, so there is a large subjective Randomness. For this reason, in view of the uncertainty of the textile production process,
[0064] The construction process of the basic probability distribution function in Dempster-Shafer (D-S) evidence theory is as follows:
[0065] S1, the construction of distance and correlation measurement relationship
[0066] Let the feature vector of the evidence body (sensor) be X j , Target (monitoring type) A j The standard sample feature vector is Y j. Then the Manhattan distance between the two is: d ij (X i , Y j )=∑|X ik -Y ik |;
[0067] From the above formula, the distance d ij (X i , Y j ) Is larger, the evidence body i and target A j The lower the correlation degree; on the contrary, the distance d ij (X j , Y j ) Is smaller, the evidence body i and target A j The higher the degree of correlation; therefore, the definition: C i (A j )=1/d ij (X i , Y j ), the greatest correlation between the evidence body and the target is:
[0068] α i =max{C i (A j )}=1/min{d ij (X i , Y j )}.
[0069] The distribution coefficient of the correlation coefficient between evidence body i and each target is:
[0070] Where N is the number of target types to be tested;
[0071] The reliability coefficient of the evidence body (sensor) i is:
[0072] S2, basic probability distribution function construction
[0073] Synthesize the formula in S1 to get evidence body i and assign target A j The basic probability distribution and the basic probability distribution assigned to the recognition framework Θ, that is, the calculation method of the uncertainty probability value of the sensor is as follows:
[0074] m i ( A j ) = w i C i ( A j ) X i w i C i ( A j ) + N s ( 1 - R i ) ( 1 - α i β j ) - - - ( 1 )
[0075] m i ( θ ) = N s ( 1 - R i ) ( 1 - α i β j ) X j w i C i ( A j ) + N c ( 1 - R i ) ( 1 - α i β j ) - - - ( 2 )
[0076] Where N s Is the number of sensors, w i Is the weighting coefficient, and according to the correlation coefficient C i (A j ) Takes the value, and 0 i <1;
[0077] Analyze formulas (1) and (2). First, it satisfies the definition condition of the mass function, and when calculating the basic probability distribution of the evidence body (sensor) to the target (including Θ), the evidence body (sensor) and the target ( The corresponding relationship between the distance and the correlation between the monitoring type), the distribution of the correlation, and the sensor reliability coefficient; then, according to the correlation between the evidence body and the target, a weighting coefficient is introduced to output the decision result, which effectively enhances the decision The correctness of the results.
[0078] The above are only the preferred embodiments of the present invention. It should be pointed out that for those of ordinary skill in the art, without departing from the principle of the present invention, several improvements and modifications can be made, and these improvements and modifications should also be made. It is regarded as the protection scope of the present invention.

PUM

no PUM

Description & Claims & Application Information

We can also present the details of the Description, Claims and Application information to help users get a comprehensive understanding of the technical details of the patent, such as background art, summary of invention, brief description of drawings, description of embodiments, and other original content. On the other hand, users can also determine the specific scope of protection of the technology through the list of claims; as well as understand the changes in the life cycle of the technology with the presentation of the patent timeline. Login to view more.
Why Eureka
Try Eureka