Market network visualization method based on density clustering and force guidance algorithm

A density clustering, market technology, applied in the field of information visualization and visual analysis

Active Publication Date: 2017-05-17
CHINA TOBACCO GUANGXI IND
View PDF2 Cites 14 Cited by
  • Summary
  • Abstract
  • Description
  • Claims
  • Application Information

AI Technical Summary

Problems solved by technology

[0005] One purpose of the present invention is to solve the problem of market network visualization, so that ent

Method used


Image

  • Market network visualization method based on density clustering and force guidance algorithm
  • Market network visualization method based on density clustering and force guidance algorithm
  • Market network visualization method based on density clustering and force guidance algorithm

Examples


Embodiment 1

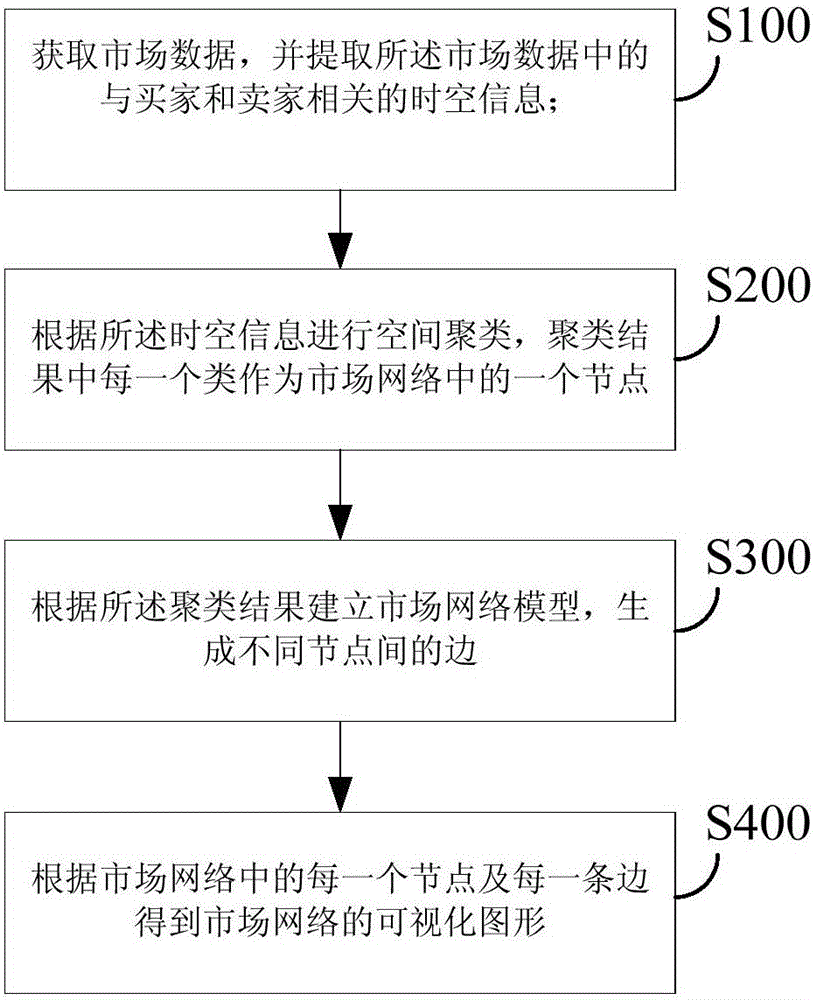
[0077] This embodiment provides a market network visualization method based on density clustering and force-guided algorithms, such as figure 1 shown, including the following steps:

[0078] S100: Obtain market data, and extract spatio-temporal information related to buyers and sellers in the market data; wherein the market data can be obtained by manufacturers after sorting out sales data during the sales process, and buyers and sellers are related The spatio-temporal information can include: user ID, mobile phone number, product type, sales volume, price, profit, address, GPS positioning information, transaction time, etc. Other relevant data that can provide manufacturers with demand analysis is also available. Specifically, acquire the buyer and seller data in the market database according to the preset format, delete the data that does not meet the preset requirements in the buyer and seller data, and obtain the cleaned data table; The address is resolved into latitude a...

Embodiment 2

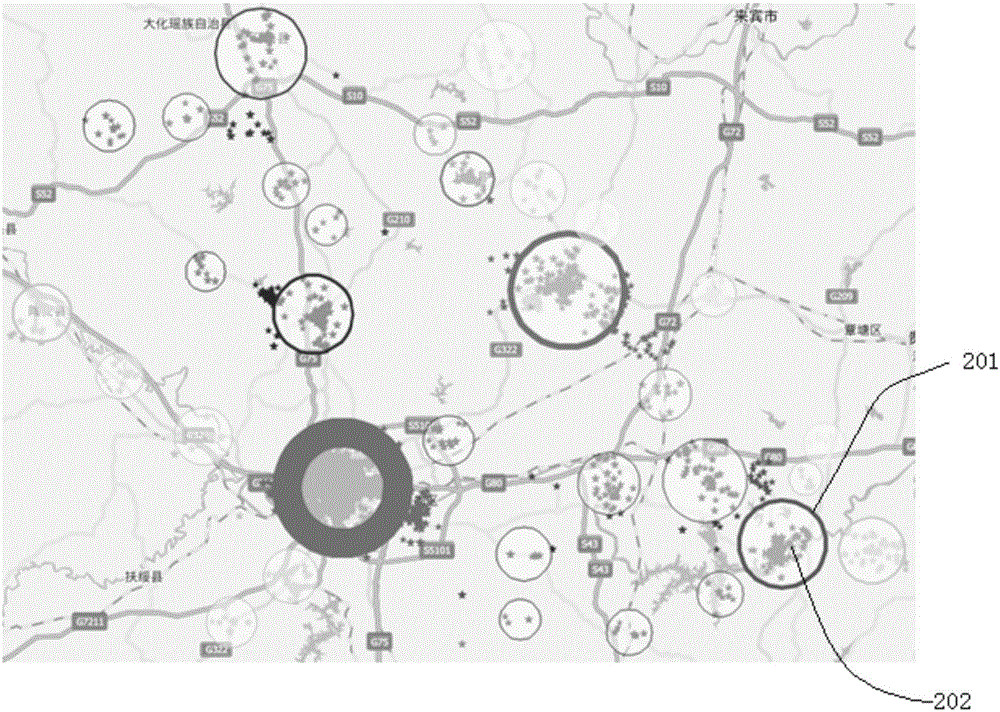
[0085] On the basis of Embodiment 1, this embodiment provides a method for establishing a market network model based on the clustering results and generating edges between different nodes, including the following steps:

[0086] S31. The user determines the sales comprehensive evaluation index according to the personalized market analysis requirements, and according to the comprehensive evaluation index score c of all N data points in each network node i Perform cumulative calculations to obtain the comprehensive evaluation score of each network node in the network

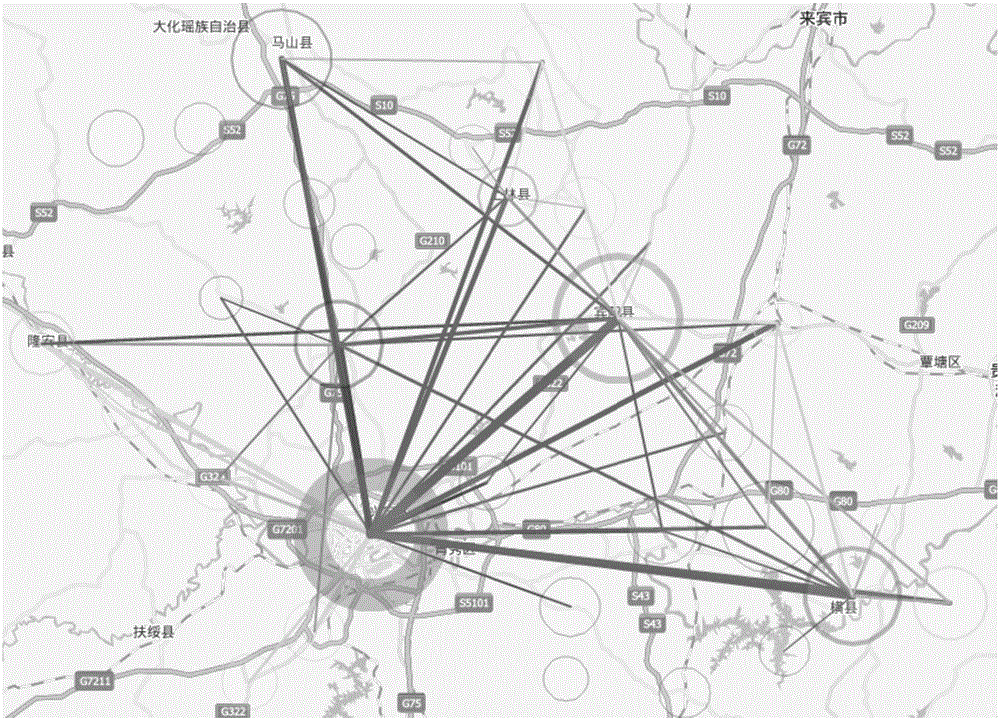
[0087] S32. Calculate the center point position of each network node in the network according to the longitude coordinate ln and latitude coordinate la of all N data points in each network node, and the calculation formula is: center point accuracy value Center point latitude value

[0088] S33. According to the universal gravitational force formula, design a force-guided formula of market sales gravity betw...

Embodiment 3

[0116] Figure 10 It is a schematic diagram of the hardware structure of the electronic device that implements the market network visualization method based on the density clustering and force-guided algorithm provided by this embodiment, as shown in Figure 10 As shown, the equipment includes:

[0117] one or more processors 501 and memory 502, Figure 10 A processor 501 is taken as an example.

[0118] The device for implementing the market network visualization method based on the density clustering and force guidance algorithm may further include: an input device 503 and an output device 504 .

[0119] The processor 501, the memory 502, the input device 503 and the output device 504 may be connected via a bus or in other ways, Figure 8 Take connection via bus as an example.

[0120] The memory 502, as a non-volatile computer-readable storage medium, can be used to store non-volatile software programs, non-volatile computer-executable programs and modules, such as the ...


PUM


Abstract

The invention provides a market network visualization method based on the density clustering and the force guidance algorithm. The method comprises steps of carrying out preprocessing on market data and extracting time-spatial information so as to generate a market multivariate data sheet; according to the time-spatial information of buyers and sellers in the market data, carrying out density-based space clustering so as to automatically generate nodes in the market network, wherein one category is one node in the market network; according to the force guidance algorithm, establishing a self-organization market network model so as to automatically generate edges between categories in the market network; and according to the calculated nodes and edges of the market network, carrying out visualization. According to the invention, visualization can be performed on any market data containing time-spatial information; a vivid, highly-efficient and clear market network can be displayed on an electronic map; and market data analysis of industries and enterprises can be improved.

Description

technical field [0001] The invention relates to the fields of information visualization and visual analysis, in particular to a market network visualization method based on density clustering and force guidance algorithms. Background technique [0002] A market is an abstraction made up of a myriad of ever-changing buyers and sellers. The state of the market is changing rapidly. It is a large-scale, dynamic, and continuously changing process. Consumer behavior is often random and uncertain. Customer groups are dynamically developing. People's understanding of the market is often vague and inconsistent. The market is the soil for the survival and the source of development of an enterprise, the product marketing network is the lifeline of the enterprise, and market analysis is the key for the enterprise to formulate development strategies and work plans. [0003] The market is actually an invisible dynamic system, and "network" is often used to describe the complex relationsh...

Claims


Application Information

Patent Timeline
IPC IPC(8): G06Q10/06G06Q30/02
CPCG06Q10/067G06Q30/0201
Inventor 邓超陈智斌郭晓惠农英雄杨振宇孙忱陆瑛梁冬钟征燕
Owner CHINA TOBACCO GUANGXI IND
Why Eureka
Try Eureka