High-dimensional data visual analysis method and system

A technology of high-dimensional data and analysis methods, applied in multidimensional databases, relational databases, database models, etc., can solve problems such as difficult to effectively improve the results of subspace clustering methods, reduce the number of trials and errors, and reduce redundancy , Enhance the effect of interactivity

Inactive Publication Date: 2017-11-21
CENT SOUTH UNIV
View PDF4 Cites 7 Cited by
  • Summary
  • Abstract
  • Description
  • Claims
  • Application Information

AI Technical Summary

Problems solved by technology

However, most of the current visual analysis methods for subspace clustering are oriented towards the visualization of the results of automated

Method used


Image

  • High-dimensional data visual analysis method and system
  • High-dimensional data visual analysis method and system
  • High-dimensional data visual analysis method and system

Examples


Embodiment Construction

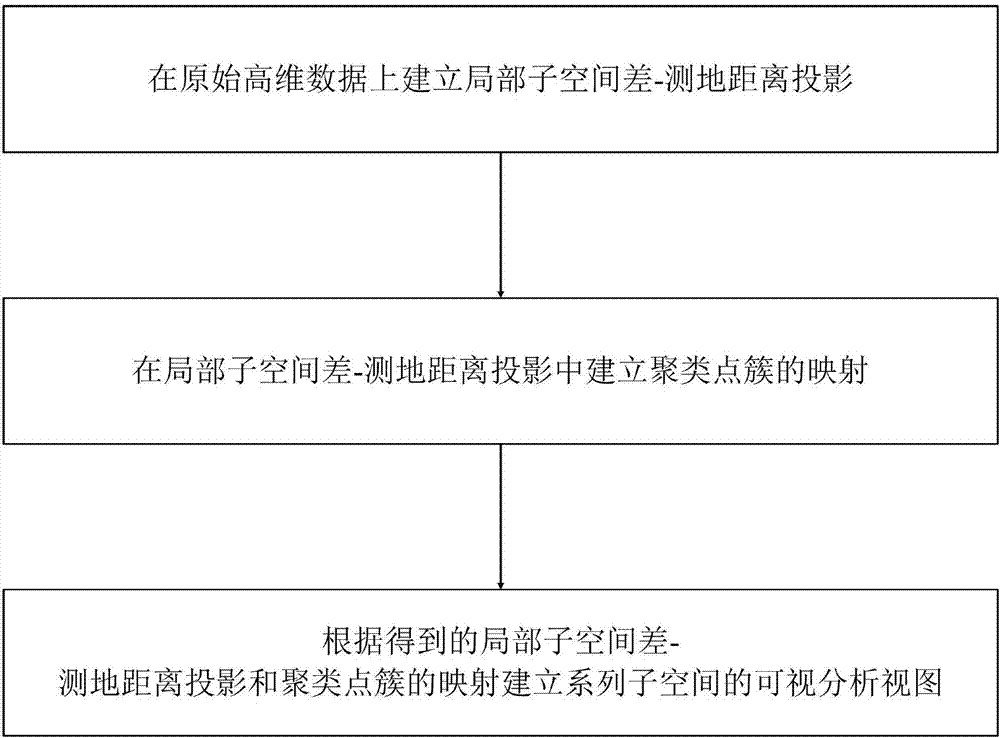
[0053] Such as figure 1 Shown is the method flowchart of the method of the present invention: the visual analysis method of this high-dimensional data provided by the present invention comprises the following steps:

[0054] S1. Establish a local subspace difference-geodesic distance projection on the original high-dimensional data. Specifically, the following steps are used to establish the projection:

[0055] A. For high-dimensional data that needs to be projected, establish a data point correlation measure based on geodesic distance. Specifically, the following steps are used to establish the measure:

[0056] Ⅰ. Construct an S-NN graph with several connected components on the basis of the high-level data set that needs to be projected; the SNN graph refers to a subgraph of the K-NN graph. Specifically, in the SNN graph, if and only if the points p, q are k-nearest neighbors, there is an edge between them;

[0057] Ⅱ. For each connected component in step Ⅰ, connect any t...


PUM


Abstract

The invention relates to a high-dimensional data visual analysis method. The method comprises the steps that local subspace difference-geodesic distance projection is built on original high-dimensional data; mapping of clustering point clusters is built; visual analysis views of a series of subspaces are built. The invention further discloses an analysis system achieving the high-dimensional data visual analysis method. Accordingly, by building mapping of the local subspace difference-geodesic distance projection and clustering point clusters and the visual analysis views of the series of subspaces, a series of interactive visual analysis operations are put forward, a reliable technological base is provided for visual subspace clustering and analysis, a user can be effectively guided and assisted to conduct effective analysis and exploration on high-dimensional data, the frequencies of tests and errors of the user are significantly reduced in the high-dimensional data processing process, the data redundancy is reduced, the interactivity of the data analysis process is enhanced, and the reliability of the result is improved.

Description

technical field [0001] The invention specifically relates to a high-dimensional data visualization analysis method and an analysis system thereof. Background technique [0002] With the development of national economy and technology and the advent of digital society, data has become an indispensable part of people's production and life. People deal with endless data every day, such as financial data, scientific computing data, biomedical data, etc. As a result, data analytics is one of the hottest areas of development today. Data mining and visual analysis technology are important parts in the field of information technology; in the process of data mining and analysis, a powerful visual analysis method will make the effect twice the result with half the effort. [0003] High dimensionality is one of the important characteristics of big data. High-dimensional data often contains subspace clustering structures. Automated subspace clustering methods often generate highly re...

Claims


Application Information

Patent Timeline
IPC IPC(8): G06F17/30
CPCG06F16/2462G06F16/2465G06F16/283G06F16/285
Inventor 夏佳志李强廖胜辉奎晓燕王建新
Owner CENT SOUTH UNIV
Why Eureka
Try Eureka