Instantaneous frequency estimation method based on Sobel operator and PauTa examination

An instantaneous frequency and operator technology, applied in computing, computer components, character and pattern recognition, etc., can solve problems such as low accuracy and precision, one-step cost function delay, and lack of adaptability of the function, so as to eliminate errors , Eliminate the effect of time delay

Active Publication Date: 2017-11-21
WEIFANG UNIVERSITY
6 Cites 1 Cited by

AI-Extracted Technical Summary

Problems solved by technology

The one-step cost function method can search for ridge points in the local frequency range, but the center point of the local frequency range depends on the position of the previous ridge point, which leads to a delay in the one-step cost function
In addition, the width of the local frequency range is set arb...

Method used

1) traditional one-step cost function needs to depend on the position of last ridge point when determining the central point of current search interval, there is time delay phenomenon, the present invention utilizes the smooth average curve after mapping as reference line, can determine immediately The center position of the current search interval does not depend on the previous ridge point at all, so it is real-time.
2)...

Abstract

The invention discloses an instantaneous frequency estimation method based on a Sobel operator and a PauTa examination. The method comprises steps of using the short-time Fourier transform to convert an original signal into a time frequency spectrogram; using the Sobel detection algorithm to acquire multiple ridge belts; using the PauTa examination to exclude an abnormal value of each ridge belt; constructing a synthesized ridge belt with a complete clear edge through superposition; using the PauTa examination to exclude an abnormal value of the synthesized ridge belt; calculating a mean curve of the synthesized ridge belt; carrying out smoothing processing on the mean curve; calculating the confidence interval of the smooth mean curve at the 95% of confidence level; mapping the smooth mean curve and the confidence interval thereof to a target ridge line to obtain a reference line and a local searching interval of the target ridge line; and using a non-delay cost function to extract the target ridge line. According to the invention, the method is suitable for estimation of instantaneous frequency of complex multi-component variable frequency signals; defects in estimation of the instantaneous frequency of mechanical vibration signals in the prior art are overcome; accuracy and precision of estimation results are high; and the method is easily used in engineering application.

Application Domain

Technology Topic

Image

  • Instantaneous frequency estimation method based on Sobel operator and PauTa examination
  • Instantaneous frequency estimation method based on Sobel operator and PauTa examination
  • Instantaneous frequency estimation method based on Sobel operator and PauTa examination

Examples

  • Experimental program(1)

Example Embodiment

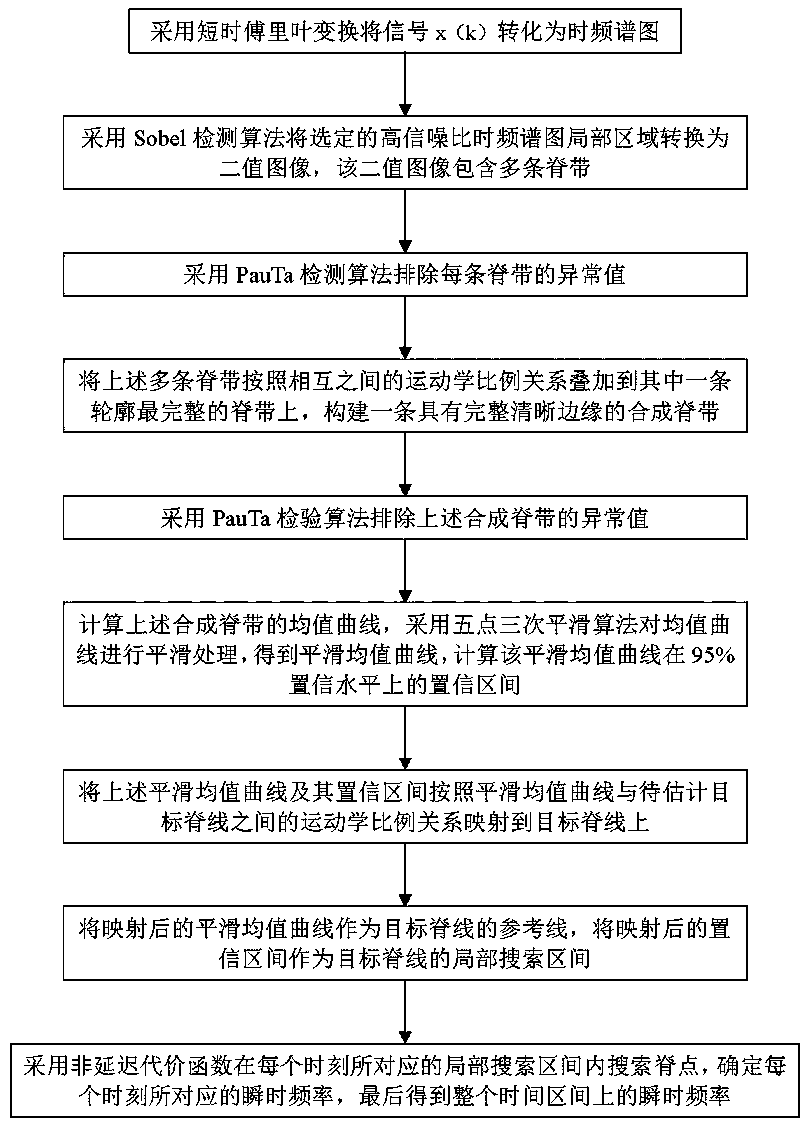
[0058] Examples such as figure 1 As shown, the instantaneous frequency estimation method based on Sobel operator and PauTa test includes the following steps:
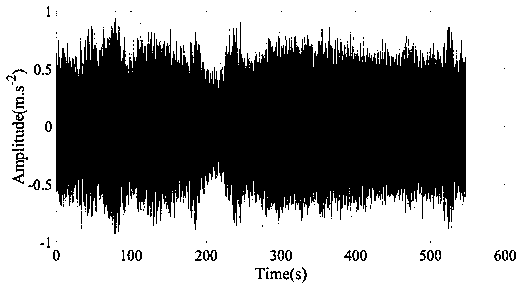
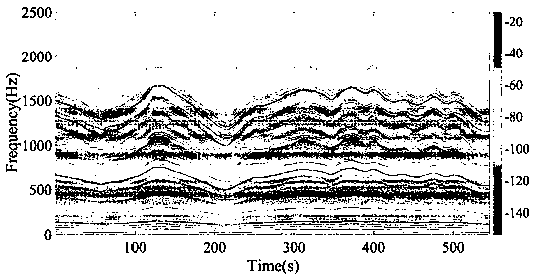
[0059] Step 1: Use the short-time Fourier transform algorithm to convert the signal x(k) (k=1, 2, …, N) into a time-spectrogram, where N represents the length of the signal;
[0060] Step 2: Select a local area with a higher signal-to-noise ratio from the time-spectrogram, and use the Sobel detection algorithm to convert the local area into a binary image. The binary image contains multiple ridges; a local area means at least two Ridge band, the area where the signal-to-noise ratio is greater than 80dB;
[0061] Step 3: Use the PauTa test algorithm to eliminate the outliers at the upper and lower edges of each ridge;
[0062] Step 4: The above multiple ridges are superimposed on one of the ridges with the most complete contour according to the kinematic ratio relationship between each other to construct a synthetic ridge with a complete and clear edge; the kinematics proportional relationship refers to the position of the ridge The transmission ratio between the corresponding machine parts;
[0063] Step 5: Use the PauTa test algorithm to eliminate the abnormal values ​​of the upper and lower edges of the synthetic ridge band;
[0064] Step 6: Calculate the mean curve of the aforementioned synthetic ridge band, use the five-point triple smoothing algorithm to smooth the mean curve to obtain a smooth mean curve, and calculate the confidence interval of the smooth mean curve at the 95% confidence level;
[0065] Step 7: Map the above smooth mean curve and its confidence interval to the target ridge line according to the kinematic proportional relationship between the smooth mean curve and the target ridge line to be estimated;
[0066] Step 8: Use the mapped smooth mean curve as the reference line of the target ridge, and use the mapped confidence interval as the local search interval of the target ridge;
[0067] Step 9: Use the non-delay cost function to search for ridge points in the local search interval corresponding to each moment, determine the instantaneous frequency corresponding to each moment, and finally obtain the instantaneous frequency over the entire time interval.
[0068] The short-time Fourier transform algorithm in step 1 includes the following steps:
[0069] 1) Perform a short-time Fourier transform on the signal x(k):
[0070] ,
[0071] TF(t, f) represents the result of the short-time Fourier transform of the signal x(k), t represents the time factor, f represents the scale factor, and the function w(z) represents the window function with the independent variable z;
[0072] 2) Calculate the time spectrum of the signal x(k):
[0073] ,
[0074] spectrogram(t, f) represents the time spectrum of x(k).
[0075] The Sobel detection algorithm in step 2 includes the following steps:
[0076] 1) If f(x, y) represents the original image, x represents the time point of the image, y represents the frequency point of the image, and G x (x, y) represents the image obtained by horizontal edge detection, G y (x, y) represents the image obtained by vertical edge detection:
[0077] , ,
[0078] The symbol * represents convolution calculation;
[0079] 2) Calculate the gradient value G(x, y) of the image gray level:
[0080] ;
[0081] 3) Set an appropriate threshold. If the gradient value G(x, y) of a certain point (x, y) on the image is greater than the threshold, then the point is judged to be an edge; in the present invention, the threshold is set to 3.11×10 -6.
[0082] The PauTa test algorithm in step 3 includes the following steps:
[0083] 1) Estimated signal x n (N=1, 2, …,N) standard deviation,
[0084] ,
[0085] Represents the sample mean, σ represents the sample standard deviation, and N represents the sample length;
[0086] 2) If , Then remove x n.
[0087] The non-delayed cost function in step 9 includes the following steps:
[0088] 1) The local search interval FB corresponding to the kth moment k defined as
[0089] ,
[0090] f k (pmc) represents the value of the smoothed mean curve after the mapping at the kth moment, Represents half the width of the confidence interval of the smoothed mean curve after mapping at the k-th moment, and m represents the length of the target ridge;
[0091] 2) The non-delayed cost function CF corresponding to the kth moment k defined as:
[0092] ,
[0093] ,
[0094] f k (i) Representative in FB k The frequency value within the range, TF(t k , f k ) Represents the value of TF(t, f) at the kth moment, t k Represents the value of t at the kth moment, f k Represents the value of f at the kth moment, e k Represents the weighting factor.
[0095] The performance of the algorithm of the present invention is verified by the vibration data of the fan turbine planetary gearbox.
[0096] The vibration data is collected from the gearbox housing close to the planetary gear train. The data length is N=2736825 and the sampling frequency fs=5000 Hz.
[0097] The collected vibration data of the planetary gearbox such as figure 2 Shown.
[0098] Using the short-time Fourier transform algorithm will figure 2 The vibration data of the planetary gearbox shown is converted into a time-spectrum graph, and the time-spectrum graph obtained is as follows image 3 Shown.
[0099] From image 3 Select a local area with a high signal-to-noise ratio on the time-spectrogram as shown, and the obtained local area is as Figure 4 Shown.
[0100] Using Sobel detection algorithm Figure 4 Perform edge detection on the local area shown, and the resulting image edge is as Figure 5 Shown.
[0101] Elimination using PauTa inspection algorithm Figure 5 The abnormal points of each ridge in the middle, the results obtained are as Image 6 Shown.
[0102] According to the kinematic proportional relationship between the ridges, each ridge is superimposed on one of the ridges with the most complete contour, and the synthetic ridge is constructed as Figure 7 As shown (the lowermost ridge is the synthetic ridge).
[0103] The PauTa test algorithm is used to eliminate the abnormal points of the synthetic ridge, and the results are as follows Figure 8 Shown.
[0104] Calculate the smooth mean curve of the synthetic ridge and its 95% confidence interval, the result is as follows Picture 9 Shown.
[0105] According to the kinematic proportional relationship between the smooth mean curve and the target ridge, the smooth mean curve and its confidence interval are mapped to the target ridge, and the result is as follows Picture 10 Shown.
[0106] The non-delayed cost function is used to search the ridge point of the target ridge, and the instantaneous frequency curve obtained is as Picture 11 Shown.
[0107] Many experiments have shown that the maximum relative error between the instantaneous frequency estimated value obtained by the present invention and the actual measured value is 0.692%, and the average relative error is 0.065%, and the instantaneous frequency estimated value obtained by the one-step cost function method is different from the actual measured value. The maximum relative error between is 16.39%, the average relative error is 2.14%, the maximum relative error of the present invention is reduced by 95.78%, and the average relative error is reduced by 96.96%.
[0108] According to the experimental results, after analysis, it is believed that:
[0109] 1) The traditional one-step cost function needs to rely on the position of the last ridge point when determining the center point of the current search interval, and there is a time delay phenomenon. The present invention uses the mapped smooth mean curve as a reference line to instantly determine the current search interval The center position of, does not depend on the previous ridge at all, so it is real-time.
[0110] 2) The traditional one-step cost function method lacks self-adaptability and needs to manually set the search interval, and the search width is fixed, which inevitably brings errors. The present invention uses the mapped smooth mean curve confidence interval to automatically determine the local search Interval, the search bandwidth can automatically change with time, without manual participation, so it is adaptive.
[0111] 3) Compared with the traditional one-step cost function method, the present invention has high precision and accuracy.
[0112] Those skilled in the art should realize that the above-mentioned specific implementations are only exemplary, in order to enable those skilled in the art to better understand the content of the present invention, and should not be construed as limiting the protection scope of the present invention, as long as it is based on the present invention. The improvements made by the technical solution of the invention fall into the protection scope of the invention.

PUM

no PUM

Description & Claims & Application Information

We can also present the details of the Description, Claims and Application information to help users get a comprehensive understanding of the technical details of the patent, such as background art, summary of invention, brief description of drawings, description of embodiments, and other original content. On the other hand, users can also determine the specific scope of protection of the technology through the list of claims; as well as understand the changes in the life cycle of the technology with the presentation of the patent timeline. Login to view more.

Similar technology patents

Classification and recommendation of technical efficacy words

  • Eliminate time lag
  • Eliminate errors

Remote digital kernel phase system

InactiveCN1913561AEliminate time lagImprove flexibility and securityTelephonic communicationPhase detectorMobile end
Owner:ZHEJIANG UNIV +1

Fully automated vascular imaging and access system

InactiveUS20150065916A1Precise needle insertionEliminate errorsSurgical needlesSensorsVascular imagingBlood vessel
Owner:VASCULOGIC

Diet adherence system

InactiveUS20150093725A1Eliminate errorsAvoid health risksCatheterNutrition controlHealth programIndividual person
Owner:ACCESS BUSINESS GRP INT LLC
Why Eureka
Try Eureka