Dominant interharmonic spectrum distribution calculation method

A technology of harmonic spectrum and calculation method, applied in the field of power quality monitoring, can solve problems such as the inability to obtain accurate amplitude, frequency, phase information of dominant interharmonic components, frequency band aliasing, spectrum leakage, etc.

Active Publication Date: 2018-01-05
ANHUI UNIVERSITY +2
View PDF9 Cites 7 Cited by
  • Summary
  • Abstract
  • Description
  • Claims
  • Application Information

AI Technical Summary

Problems solved by technology

Wavelet transform can well reflect the time domain and frequency domain characteristics of the signal in the time-frequency diagram, but there are serious defects: frequency band aliasing, leakage and other problems
However, the inter-harmonic measurement results are rep

Method used


Image

  • Dominant interharmonic spectrum distribution calculation method
  • Dominant interharmonic spectrum distribution calculation method
  • Dominant interharmonic spectrum distribution calculation method

Examples


Embodiment Construction

[0030] The technical solutions in the embodiments of the present invention will be clearly and completely described below in conjunction with the accompanying drawings in the embodiments of the present invention. Obviously, the described embodiments are only some of the embodiments of the present invention, not all of them. Based on the embodiments of the present invention, all other embodiments obtained by persons of ordinary skill in the art without making creative efforts belong to the protection scope of the present invention.

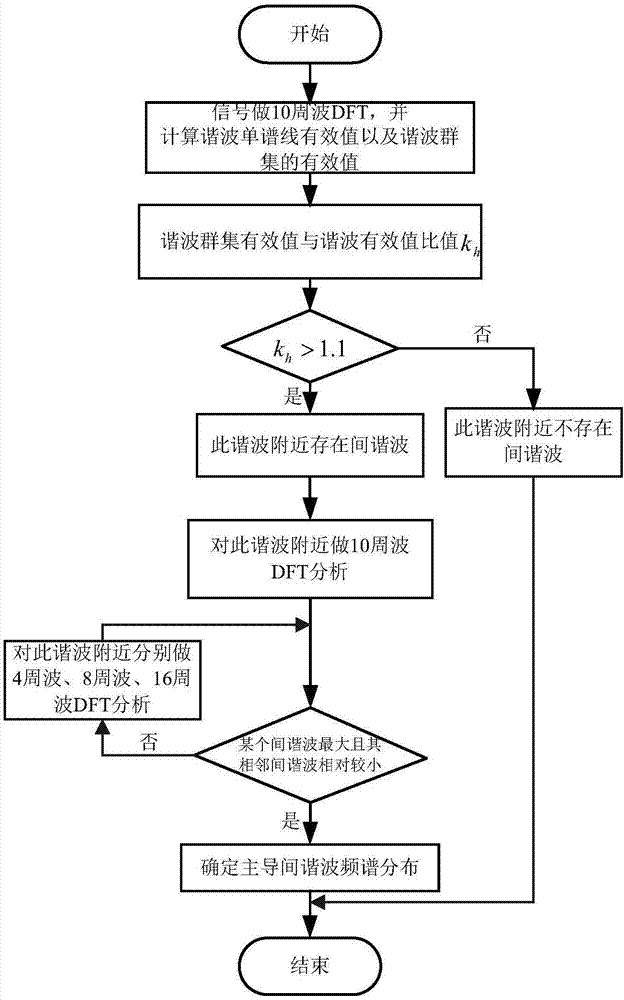
[0031] figure 1 It is a flow chart of a calculation method for a dominant interharmonic spectrum distribution provided by an embodiment of the present invention. Such as figure 1 As shown, it mainly includes the following steps:

[0032] Step 1. Take the digital quantities of the three-phase voltage and current signals in the M-cycle time window and perform discrete Fourier transform DFT analysis to obtain a rough interharmonic signal spectrum di...


PUM


Abstract

The invention discloses a dominant interharmonic spectrum distribution calculation method. The method comprises steps: a digital quantity for three-phase voltage and current signals of an M-frequencytime window is taken for discrete Fourier transform (DFT) analysis, and a rough interharmonic signal spectrum distribution diagram is acquired; according to the rough interharmonic signal spectrum distribution diagram, a harmonic singlet effective value and a harmonic cluster effective value are calculated, and the ratio of the harmonic cluster effective value to the harmonic singlet effective value is further calculated; according to the size relationship between the ratio and a threshold, whether interharmonics exist near the harmonics is judged; and if yes, the existence range of dominant interharmonics is determined, data in a certain time window are selected for DFT analysis, and the dominant interharmonic spectrum distribution is determined. Due to the method of the invention, the dominant interharmonic spectrum distribution can be simply and quickly; a help is provided for interharmonic control; influences on a power grid by the interharmonics are reduced; and safe and stable operation of power supply equipment and power consumption equipment.

Description

technical field [0001] The present invention relates to a method for calculating the frequency spectrum distribution of dominant interharmonics, in particular to a method for measuring interharmonics in the fields of impact loads, fluctuating loads, new energy photovoltaic power generation and wind power generation in electric power systems, belonging to Technical field of power quality monitoring. Background technique [0002] In recent years, with the extensive use of various power electronic devices, interharmonic pollution exists widely in power systems and is becoming more and more serious. Inter-harmonics will endanger the safe and stable operation of the power supply system and affect the normal and stable operation of electrical equipment. For example, inter-harmonics will cause voltage and current waveform distortion, reduce the power factor of the load, and increase energy loss; Harmonics will interfere with the normal operation of audio equipment; frequencies clo...

Claims


Application Information

Patent Timeline
IPC IPC(8): G01R23/16
Inventor 朱明星李开金赵闪闪高敏徐斌丁津津高博骆晨陈洪波李冬森李运兵杨爱岭刘志敏刘春阳曾光余述良
Owner ANHUI UNIVERSITY
Why Eureka
Try Eureka