

Four-order tensor joint diagonalization algorithm for joint blind source separation of four data sets
A technology of joint diagonalization and blind source separation, applied in the field of fourth-order tensor joint diagonalization algorithm, which can solve the problem of insufficient algorithm accuracy, failure to fully exploit high-order joint diagonalization structures, and signal time-domain characteristics. use, etc.
- Summary
- Abstract
- Description
- Claims
- Application Information
AI Technical Summary
Problems solved by technology
Method used
Image

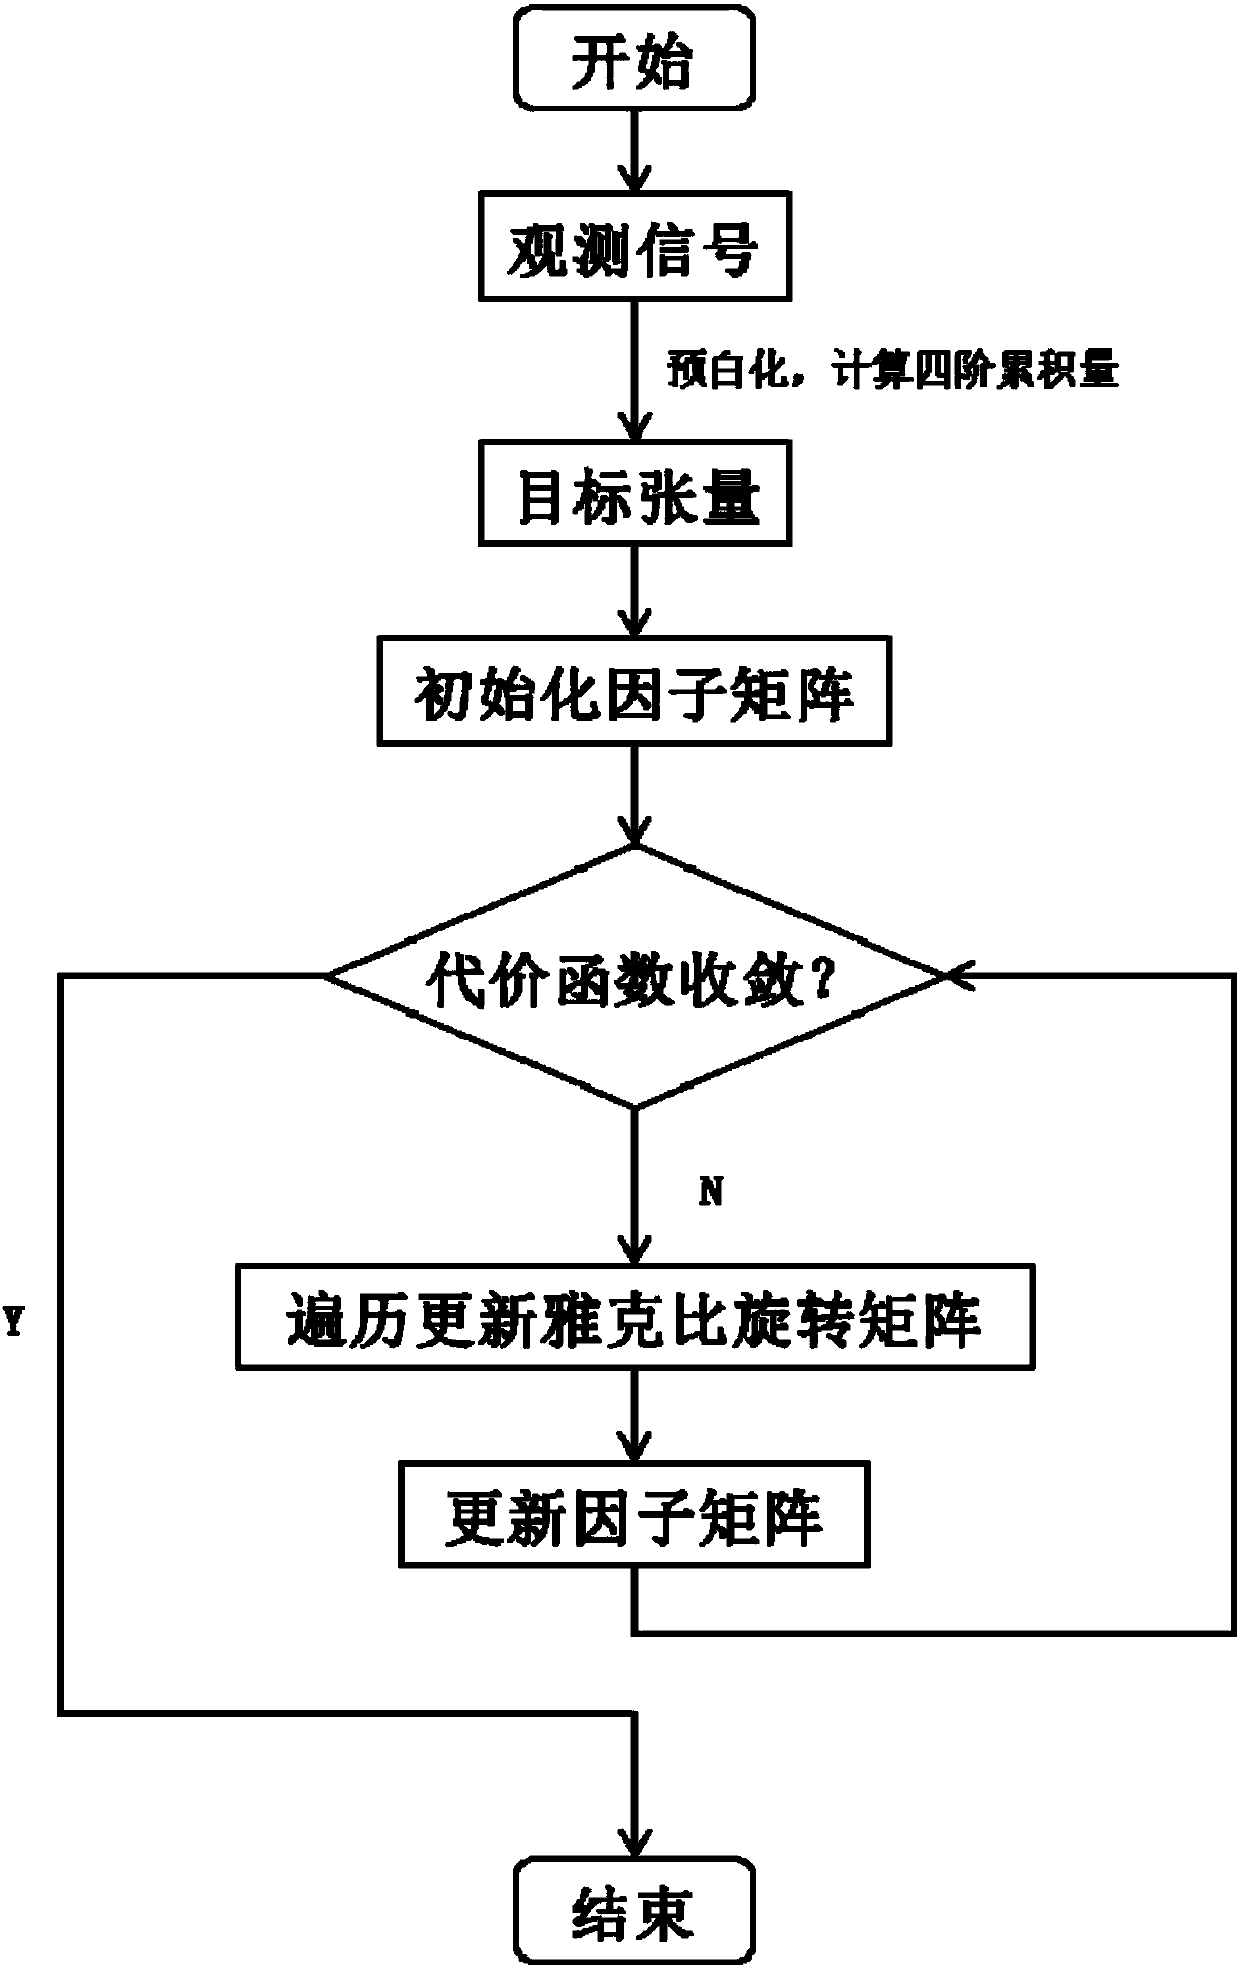
Examples
Embodiment 1
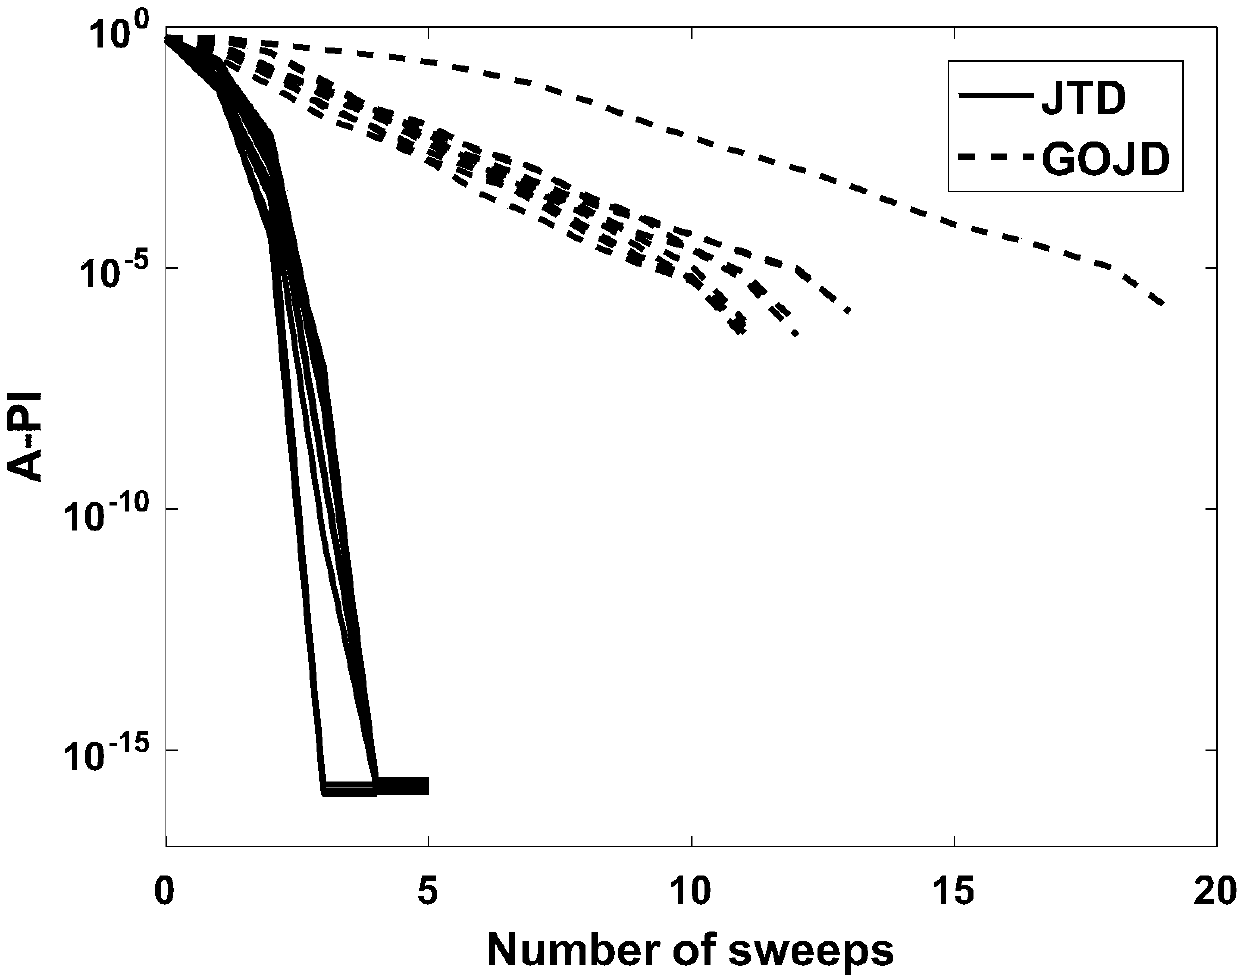
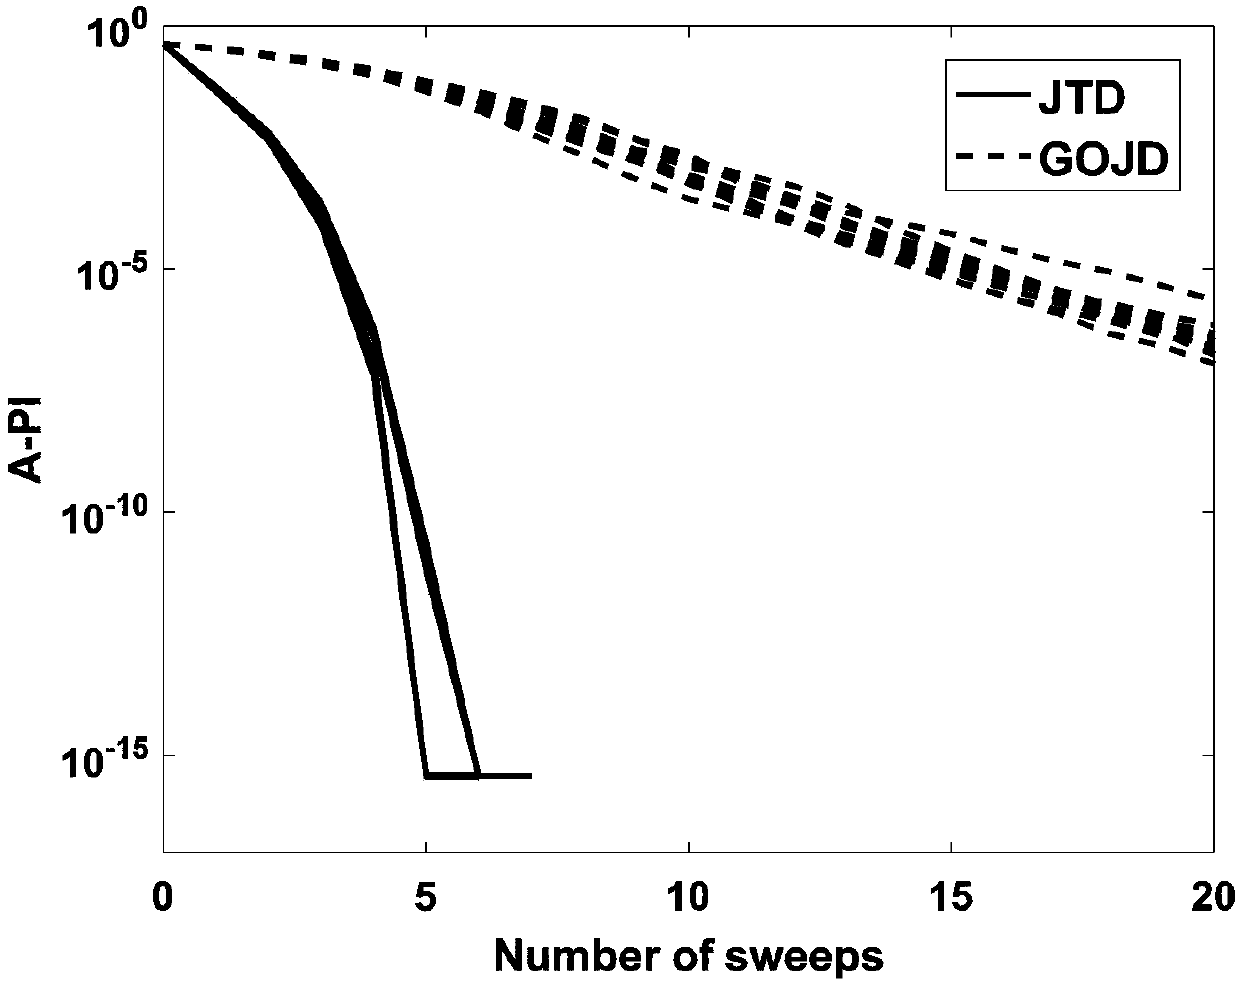
[0211] Example 1, randomly generating superdiagonal tensor D k , and unitary matrix U (1) ,U (2) ,U (3) ,U (4) , and directly construct the tensor according to the formula (4)
[0212] The performance of the algorithm is evaluated by the performance index (Performance Index: PI) defined by the following formula:
[0213]
[0214] in, Superscript Represents the Moore-Penrose pseudoinverse. The PIs of the separation results were calculated separately, and then averaged. The average PI (Average PI: A-PI) is used as the evaluation index of algorithm performance.
[0215] By calculating the PI value corresponding to the algorithm at the end of each scan, the convergence of the algorithm can be reflected. Figure 2-1 to Figure 2-4 When K and N take different values, the variation curve of the A-PI value of the JTD algorithm in 10 independent experiments with the number of scans is drawn.
[0216] As a reference, we draw the A-PI curve of the generalized orthogonal ...
Embodiment 2
[0218] Embodiment 2, in this experiment, four groups of observation signals x are generated according to formula (1A) (m) (t),m=1,2,3,4:
[0219]
[0220] where the mixing matrix A (m) ∈C N×R Randomly generated by the program, the noise term n (m) (t)∈C N×T Gaussian white noise with zero mean and unit variance.
[0221] The source signal is constructed by:
[0222] the s r (t)=Q r s' r (t), (22)
[0223] in s' r (t)∈C 4 It is a random phase signal with segmental amplitude modulation, and its phase and amplitude modulation coefficient are randomly generated by the program. Matrix Q r ∈R 4×4 Randomly generated by the program, used to introduce correlation between sets. It is not difficult to know that the constructed source signals are non-stationary and non-Gaussian signals (assumption A3), and the source signals of different data sets satisfy the inter-group correlation and intra-group independence assumptions (assumptions A1, A2).
[0224] In formula (21),...
Embodiment 3
[0239] Example 3, the experiment aims to extract the FECG signal from the actually collected observation data mixed with maternal ECG (Mother ECG, MECG), fetal ECG (Fetal ECG, FECG), and other interference signals.
[0240] The eight-channel ECG data used is taken from the DAISY database 0 of the University of Leuven, and the signal waveform is as follows: Figure 4 shown. The sampling frequency is 250Hz, the number of sampling points is 2500, and the sampling time is 10s, such as Figure 4 Shown is the eight-channel ECG data actually collected, and the data is taken from the DAISY database of the University of Leuven.
[0241] According to the following formula, the eight observation signals are divided into four data sets, and each data set contains five observation signals:
[0242]
[0243] The observation signals of the four data sets are pre-whitened and segmented, each segment length is L=500, and the overlap rate is α=0.5. It is not difficult to know that K=10 at...
PUM
 Abstract
Description
Claims
Application Information