Multi-component seismic data migration imaging method and system

A migration imaging and multi-component technology, applied in the field of seismic exploration, can solve the problems of affecting accuracy, inability to obtain high-quality migration sections, difficult seismic data processing and interpretation of migration sections, etc.

Active Publication Date: 2018-11-13
CHINA UNIV OF PETROLEUM (EAST CHINA)
View PDF3 Cites 16 Cited by
  • Summary
  • Abstract
  • Description
  • Claims
  • Application Information

AI Technical Summary

Problems solved by technology

However, different from the conventional pre-stack depth migration theory, the least squares migration is derived from the formula based on the medium disturbance theory, and its migration profile is related to the relative change of the subsurface medium parameters. The physical meaning of the pre-depth migration profile is completely different, and it cannot directly represent the four reflection coefficient information of PP, PS, SP, and SS of the subsurface medium. Therefore, it is difficult for the migration profile to be directly used for subsequent seismic data processing and interpretation, which will affect the storage capacity. Accuracy of layer prediction, fluid identification, etc.
Therefore, for actual data, the existing least-squares migration method for multi-component seismic data cannot obtain high-quality migration sections with clear physical meaning.

Method used


Image

  • Multi-component seismic data migration imaging method and system
  • Multi-component seismic data migration imaging method and system
  • Multi-component seismic data migration imaging method and system

Examples


Embodiment 1

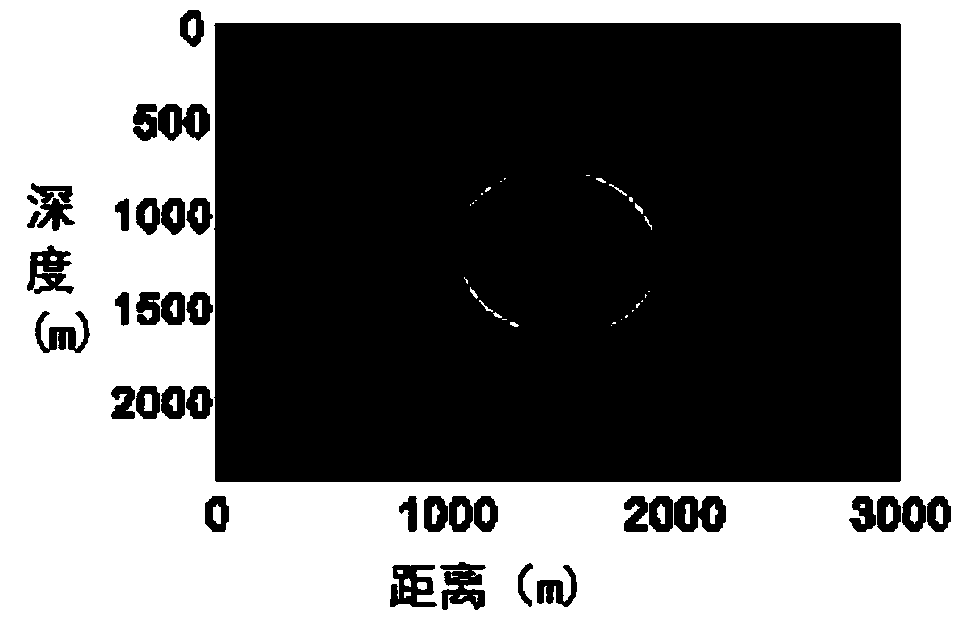
[0173] Figure 3-Figure 8 It is a snapshot of the seismic wavefield at 350ms for the homogeneous medium model. in, image 3 is the X component simulated by the finite difference method in Embodiment 1 of the present invention; Figure 4 is the Z component simulated by the finite difference method in Embodiment 1 of the present invention; Figure 5 Utilize the P component separated by the method of the present invention for embodiment 1 of the present invention; Figure 6 It is the S component separated by the method of the present invention in Example 1 of the present invention; Figure 7 It is the X component synthesized by the method of the present invention in Example 1 of the present invention; Figure 8 It is the Z component synthesized by the method of the present invention in Example 1 of the present invention. Will image 3 and 4 and Figure 5 and 6 It can be seen from the comparison that the longitudinal and transverse waves are effectively separated, which p...

Embodiment 2

[0175] Figure 9-Figure 10 is the two-dimensional sag migration velocity model diagram, Figure 9 is the longitudinal wave velocity model in Embodiment 2 of the present invention; Figure 10 It is the shear wave velocity model in Embodiment 2 of the present invention. Set up 30 explosion sources on this model, the source wavelet is set as Lake wavelet, the main frequency is 20 Hz, the initial source point is located at (150m, 100m), and the shot interval is 100m. The receiving observation system on both sides of the middle shot is adopted, the maximum offset distance of one side is 2200m, the minimum offset distance is 150m, and the track spacing is 10m.

[0176] Figure 11-Figure 14 yes Figure 9-10 Multi-shot stacked migration section of the 2D subsidence model shown. in, Figure 11 It is the PP migration profile obtained by using the reverse time migration method in Example 2 of the present invention; Figure 12 It is the PS migration profile obtained by using the re...

Embodiment 3

[0178] Figure 15-Figure 16 is the Marmousi-2 migration velocity model, Figure 15 is the longitudinal wave velocity model in Embodiment 3 of the present invention; Figure 16 It is the shear wave velocity model in Embodiment 3 of the present invention. This model is one of the international standard models to verify the imaging effects of various migration methods. 87 explosion sources are set on this model, the source wavelet is set as Reck wavelet, the main frequency is 10 Hz, the initial source point is located at (300m, 300m), and the shot interval is 300m. The receiving observation system on both sides of the middle shooting is adopted, the maximum offset distance of one side is 5200m, and the track spacing is 20m.

[0179] Figure 17-Figure 20 yes Figure 15-16 Multi-shot stacked migration section of the Marmousi-2 model shown. in, Figure 17 It is the PP migration profile obtained by using the reverse time migration method in Example 3 of the present invention; ...


PUM


Abstract

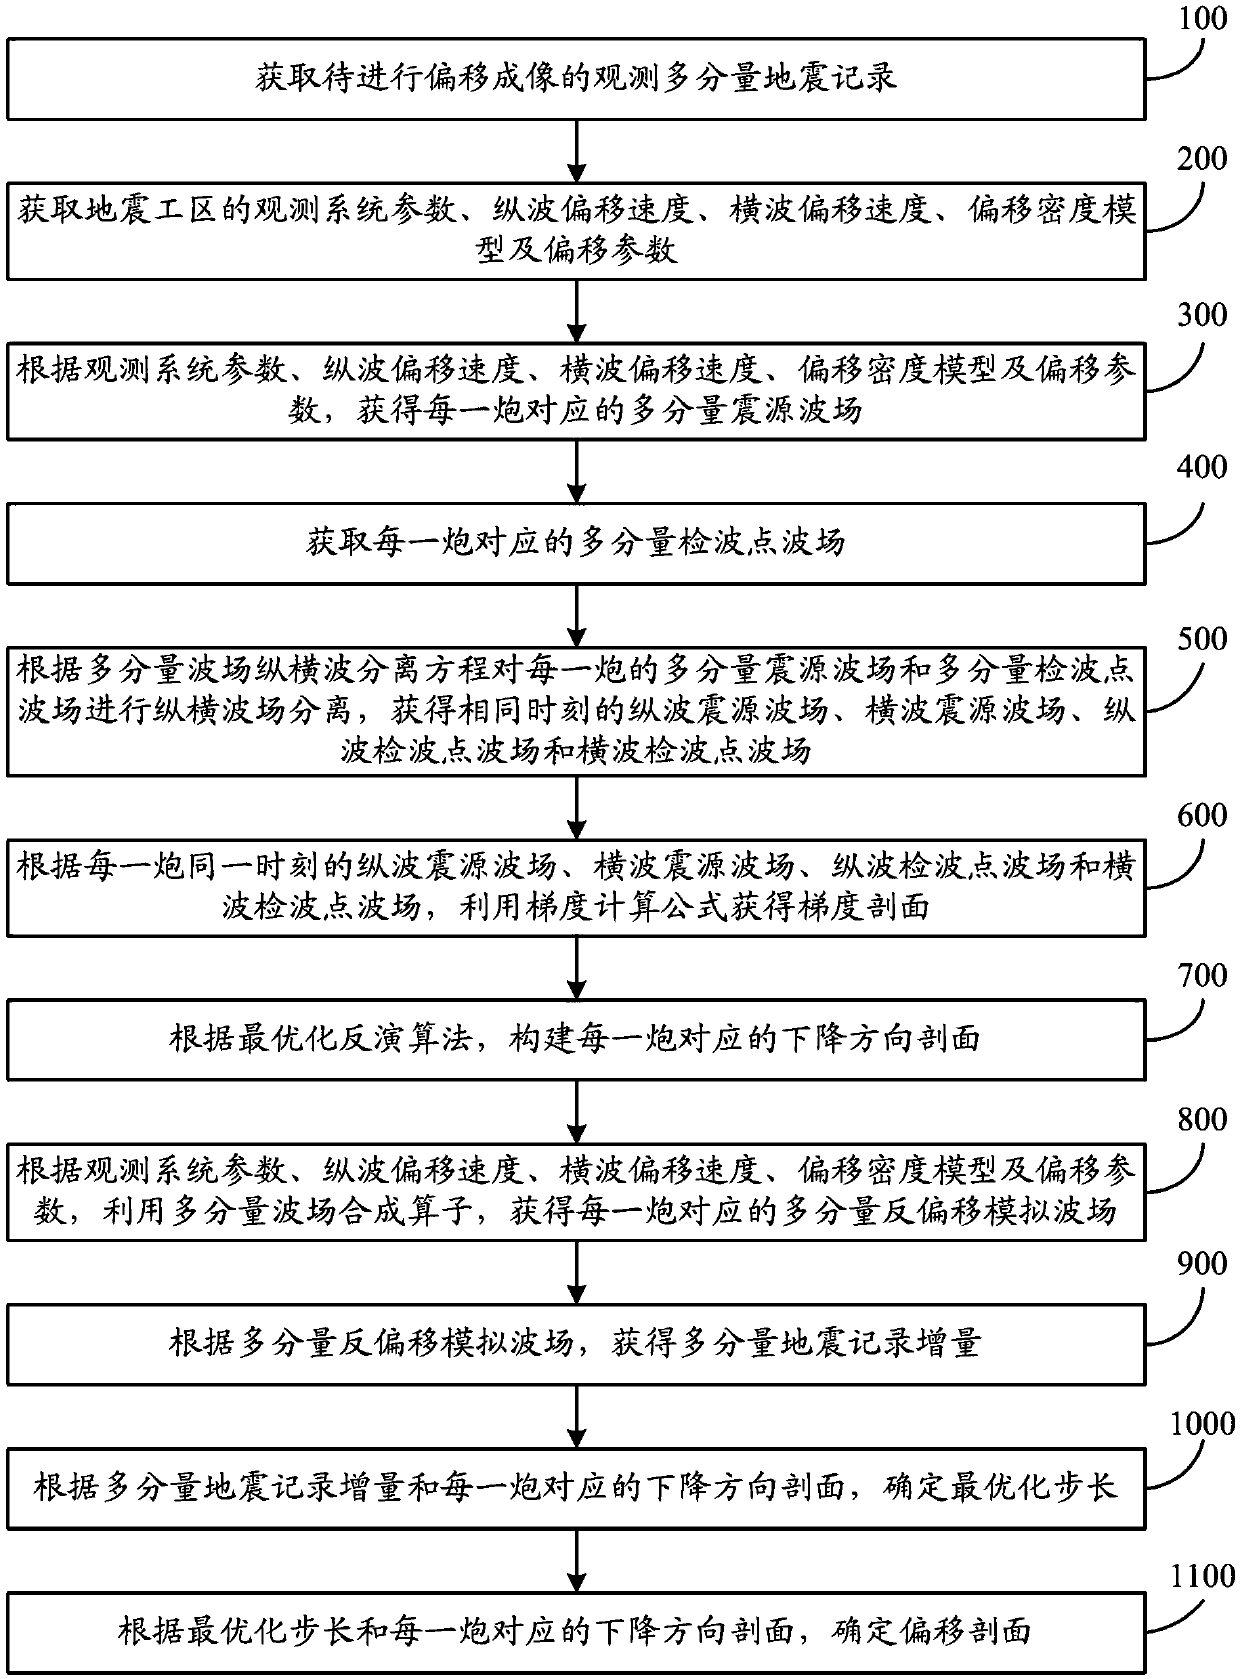
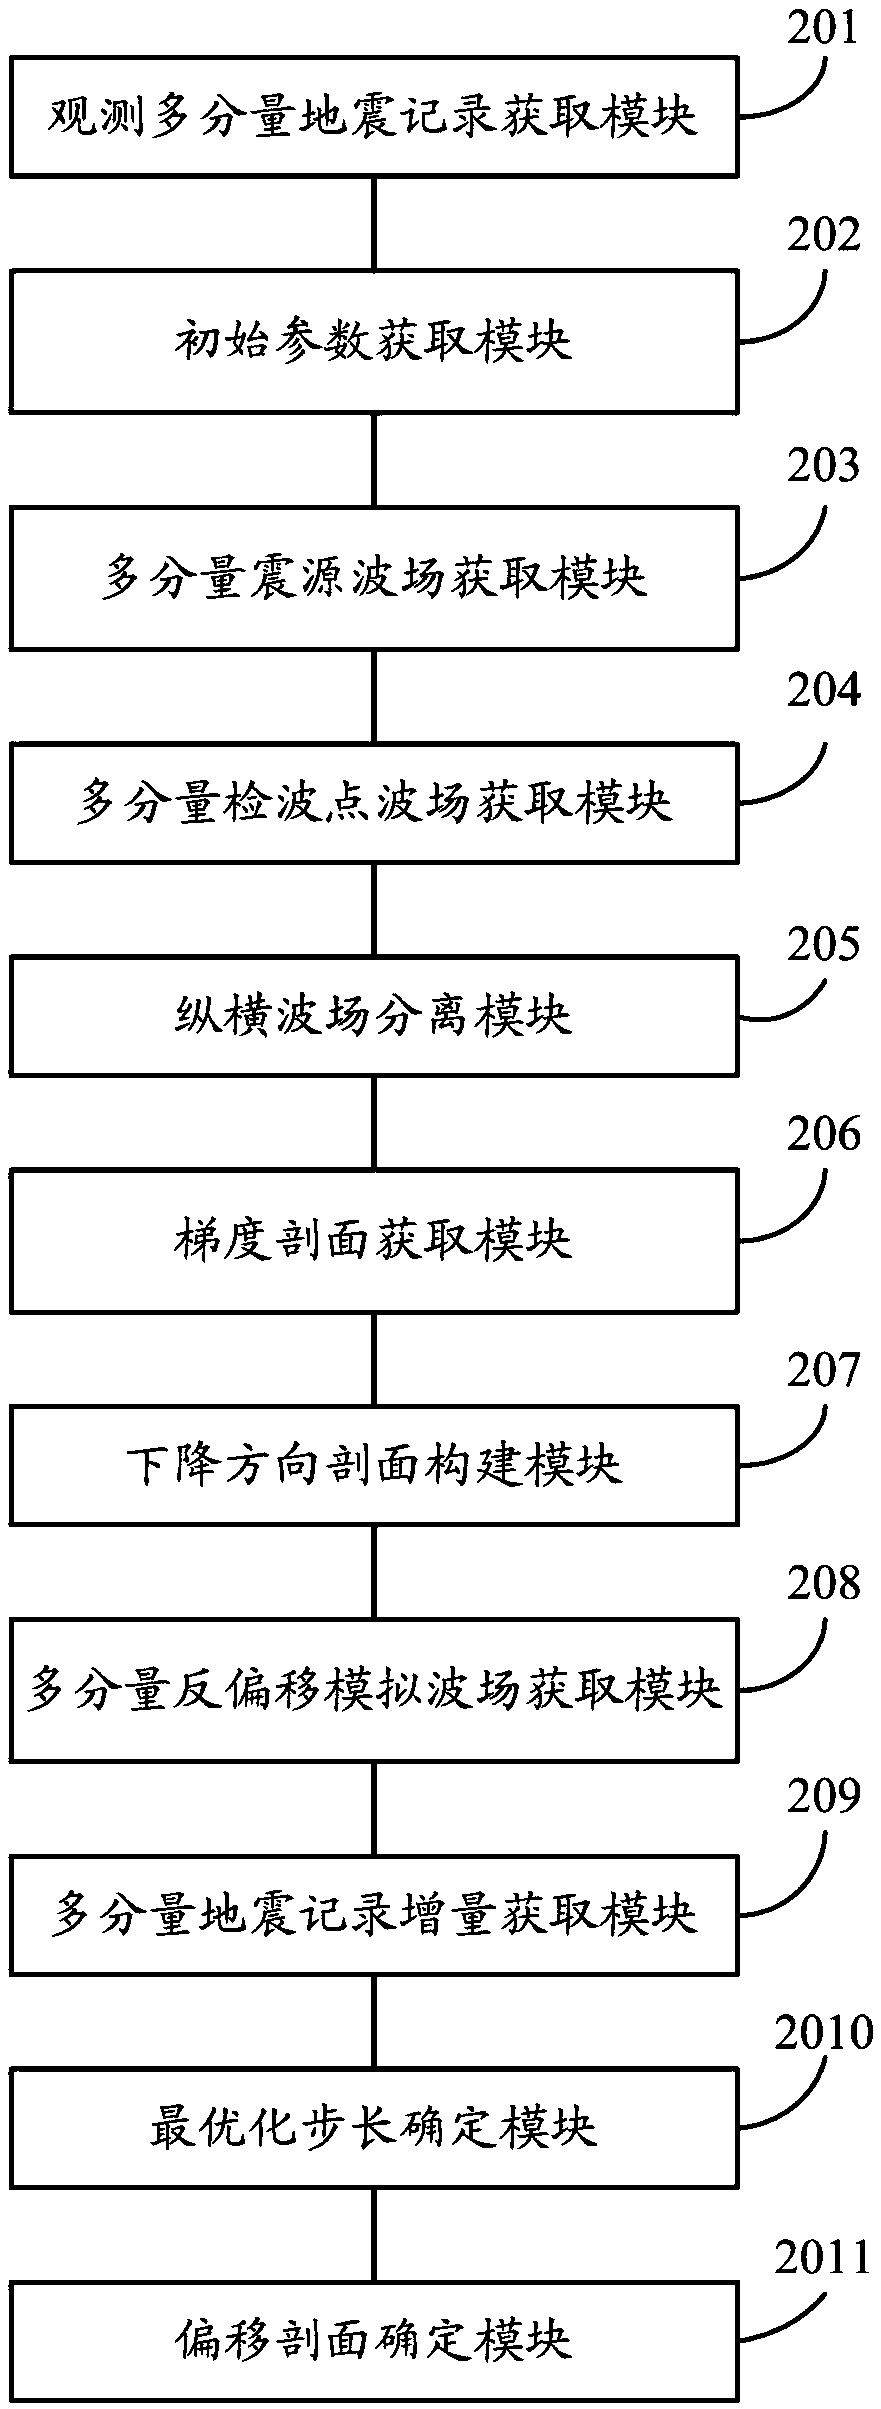
The invention discloses a multi-component seismic data migration imaging method and system. The migration imaging method comprises the following steps: acquiring observation multi-component seismic records; acquiring observation system parameters, longitudinal wave migration speed, transverse wave migration speed, a migration density model and migration parameters of a seismic work area; acquiringa multi-component centrum wave field and a multi-component detection point wave field which correspond to every cannon-shot; carrying out longitudinal and transverse field separation on the multi-component centrum wave fields and the multi-component detection point wave fields; acquiring a gradient profile by using a gradient calculating formula; constructing a declining direction profile corresponding to every cannon-shot; acquiring a multi-component demigration simulated wave field corresponding to every cannon-shot; acquiring multi-component seismic record increment; determining an optimized step length according to the multi-component seismic record increment and the declining direction profile; and determining a migration profile according to the optimized step length and the declining direction profile corresponding to every cannon-shot. By the method or system, a migration profile which can directly reflect PP, PS, SP and SS reflecting coefficient information of an undergroundmedium can be obtained.

Description

technical field [0001] The invention relates to the field of seismic exploration, in particular to a multi-component seismic data migration imaging method and system. Background technique [0002] Multi-component seismic migration imaging technology is one of the key technologies in the application of seismic exploration in oil and gas field development. The high-precision multi-component seismic migration imaging method can obtain high-quality subterranean medium structure, which provides a basis for subsequent multi-component seismic exploration interpretation. Accurate basic information. With the continuous improvement of multi-component seismic migration technology and the rapid development of high-performance computing technology, multi-component seismic migration imaging methods have gradually shifted from ray-based pre-stack time migration to wave-equation-based pre-stack depth migration. In order to obtain a migration profile with clear physical meaning and give ful...

Claims


Application Information

Patent Timeline
Patent Type & Authority Applications(China)
IPC IPC(8): G01V1/28
CPCG01V1/282
Inventor 谷丙洛李振春
Owner CHINA UNIV OF PETROLEUM (EAST CHINA)
Why Eureka
Try Eureka