
A Visualization System of High Frequency Power Flow Data

A high-frequency power and power system technology, applied in the field of power systems, can solve the problems of large amount of synchronous data, a large amount of information, and cannot meet the application of the power industry, and achieve the effect of high visualization efficiency

Active Publication Date: 2021-08-17
HUNAN UNIV +2
View PDF2 Cites 0 Cited by
  • Summary
  • Abstract
  • Description
  • Claims
  • Application Information

AI Technical Summary

Problems solved by technology

With the continuous development of the power system measurement system, the current power system data is composed of multi-source heterogeneous massive dynamic data such as D-PMU, SCADA, distributed power supply, flexible load, and electricity marketing system. The amount of synchronized data is large, and it can be obtained from The amount of extracted information has brought huge challenges to the real-time requirements of power system operation status visualization and data analysis. Simple data text display or visualization without processing can no longer meet the requirements of power industry applications

Method used


Image

  • A Visualization System of High Frequency Power Flow Data
  • A Visualization System of High Frequency Power Flow Data
  • A Visualization System of High Frequency Power Flow Data

Examples


Embodiment

[0047] Taking multi-time-scale voltage quality visualization as an example, it demonstrates the practicability of the present invention; multi-time-scale voltage optimization considers multiple adjustments including transformer taps, static var compensation, capacitor banks, energy storage devices, distributed power sources, and new loads. Means, read relevant measurement data, optimize the time scale to improve the voltage qualification rate, display the voltage qualification rate and node voltage before and after optimization, locate and check the voltage drop status of the station-line-substation based on GIS information, and quickly lock the voltage quality problem area , and automatically match the voltage characteristics, propose a comprehensive management strategy, and provide auxiliary decision support for operators


PUM


Abstract

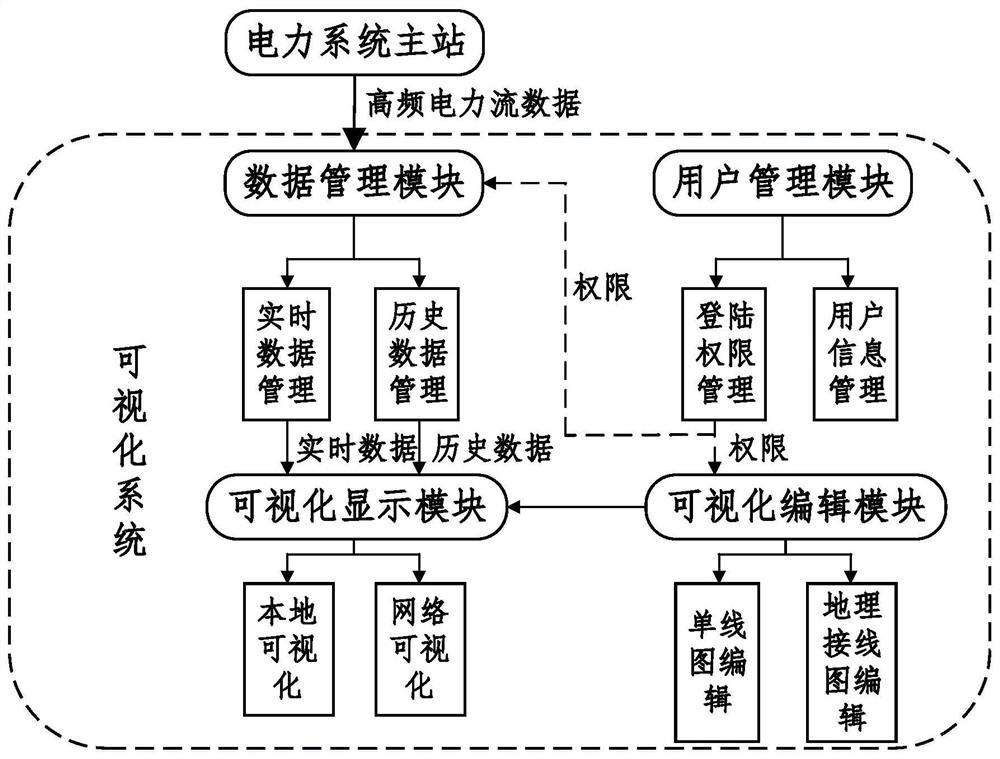
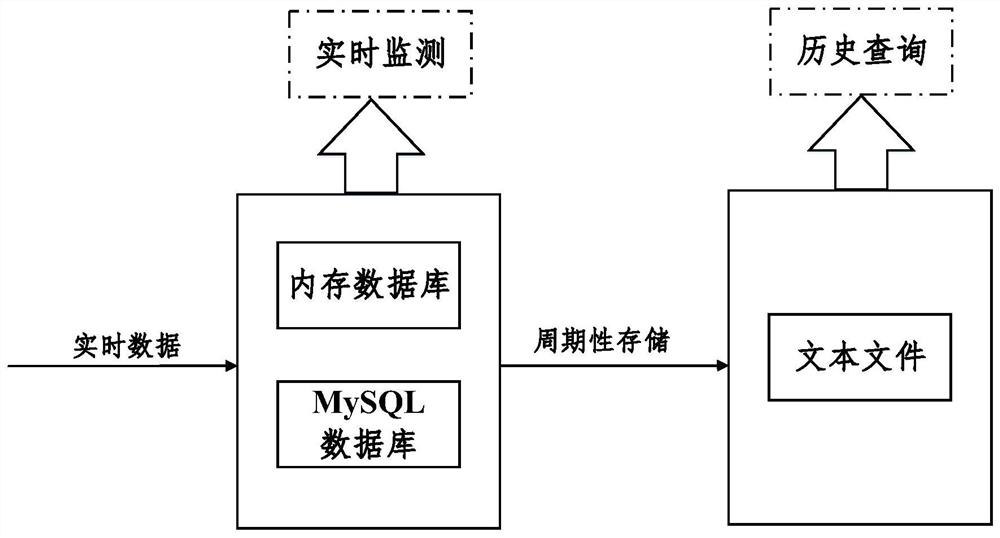
The invention relates to a high-frequency power flow data visualization system, which belongs to the technical field of power systems; it uses a combination of memory database, relational database management system MySQL and text files to manage real-time operation data, and solves the problem of high-frequency flow data The problem of storage; using the object-oriented design idea to develop the visual editing module, realizing the drawing function of the power primary wiring diagram and geographic wiring diagram; combining SVG technology and Web technology, realizing the network visualization function of power data; using Open GL The technology realizes the three-dimensional visualization of power data, and uses the improved interpolation algorithm and drawing technology to improve the visualization efficiency of high-frequency flow data and meet the real-time requirements of power monitoring.

Description

technical field [0001] The invention relates to a high-frequency power flow data visualization system, which belongs to the technical field of power systems. Background technique [0002] Power system operation status monitoring is an important part of power dispatching, which directly affects the efficiency and quality of dispatching, and power system visualization technology can intuitively display the system operating status. With the continuous development of the power system measurement system, the current power system data is composed of multi-source heterogeneous massive dynamic data such as D-PMU, SCADA, distributed power supply, flexible load, and electricity marketing system. The amount of synchronized data is large, and it can be obtained from The amount of extracted information has brought huge challenges to the real-time requirements of power system operation status visualization and data analysis. Simple data text display or unprocessed visualization can no lon...

Claims


Application Information

Patent Timeline
Patent Type & Authority Patents(China)
IPC IPC(8): G06F16/28G06F16/248G06Q50/06
CPCG06Q50/06G06F30/00
Inventor 涂春鸣李鹏何西于力帅智康郭晓斌白浩徐全闵泽莺
Owner HUNAN UNIV
Learn More