

Plasma spectroscopy analysis method
A technology of plasma and analysis method, which is applied in the direction of analyzing materials, thermal excitation analysis, electric excitation analysis, etc., can solve the problems of quantitative accuracy damage, luminous amount deviation, etc., and achieve the effect of improving accuracy
Active Publication Date: 2019-01-15
ARKRAY INC
View PDF4 Cites 4 Cited by
- Summary
- Abstract
- Description
- Claims
- Application Information
AI Technical Summary
Problems solved by technology
Quantitative accuracy may be damaged due to deviations in the amount of luminescence
Method used
View moreImage
Smart ImageViewing Examples

Examples
Embodiment
[0074] (1) Plasma spectroscopic analysis
Login to View More PUM
| Property | Measurement | Unit |
|---|---|---|
| diameter | aaaaa | aaaaa |
| height | aaaaa | aaaaa |
| composition ratio | aaaaa | aaaaa |
Abstract
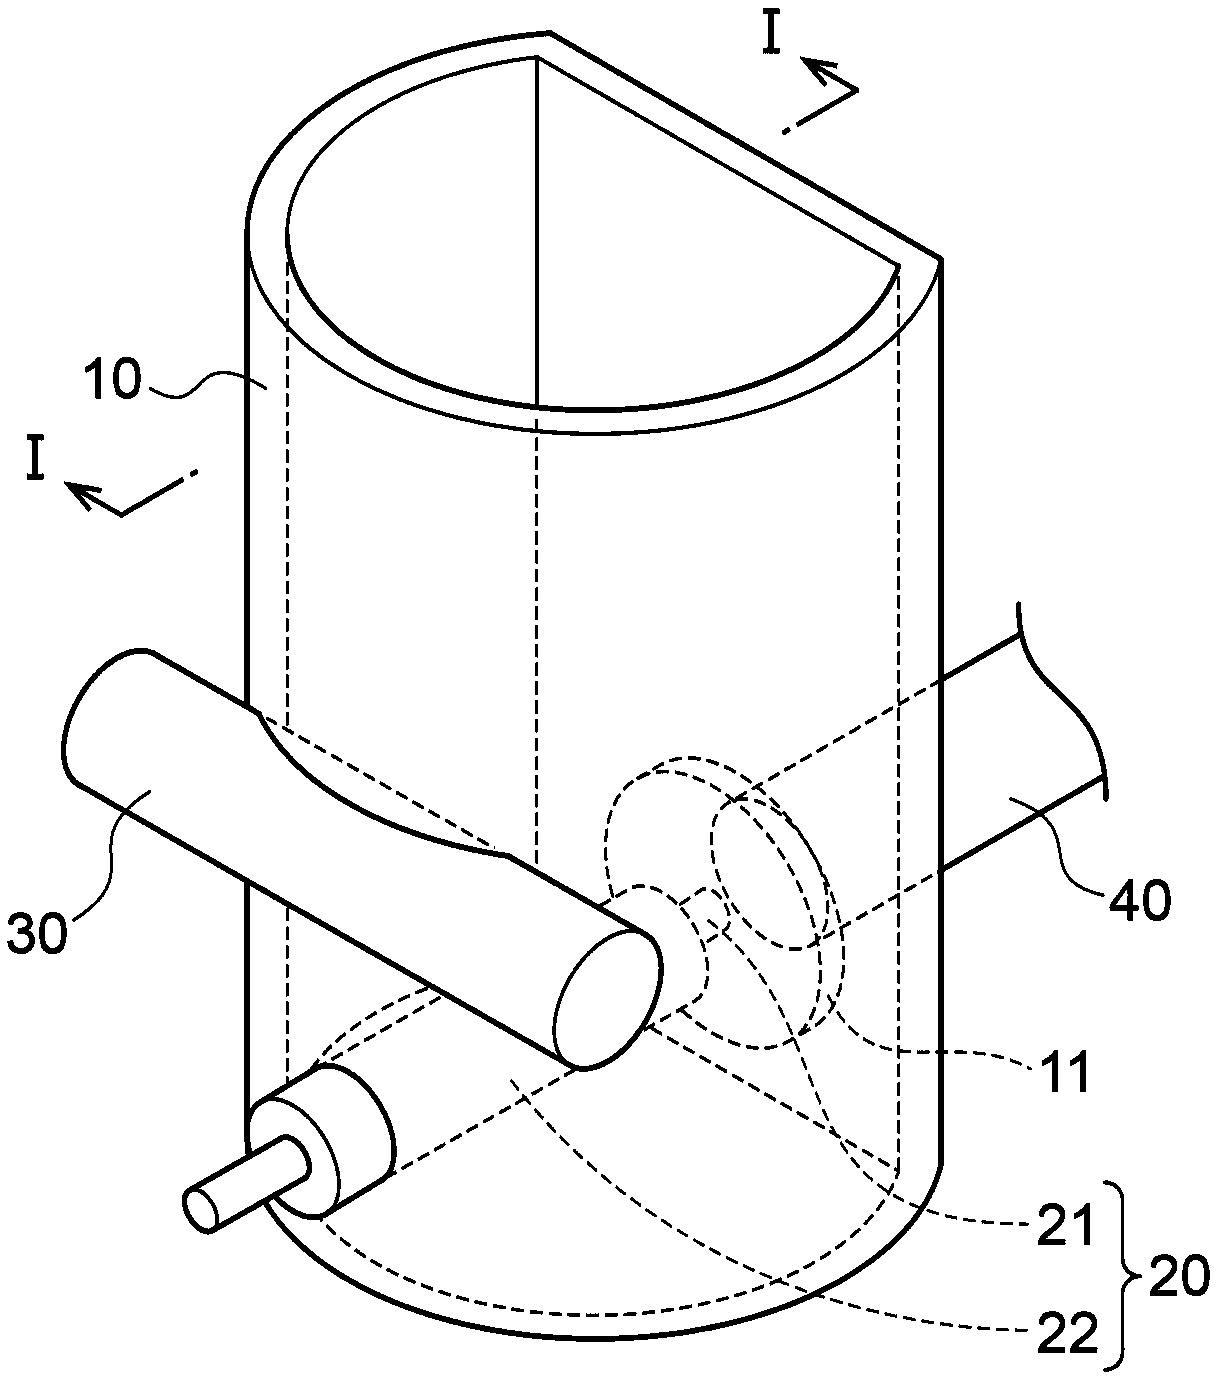
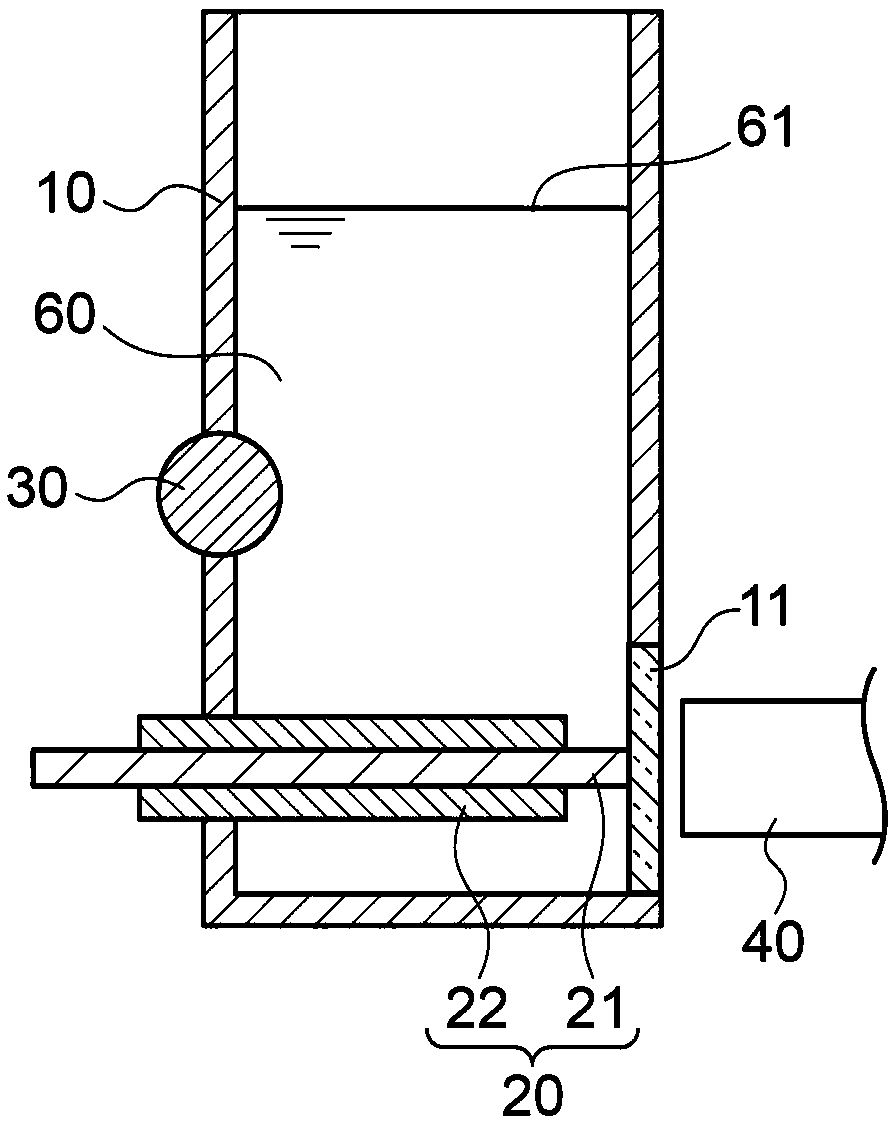
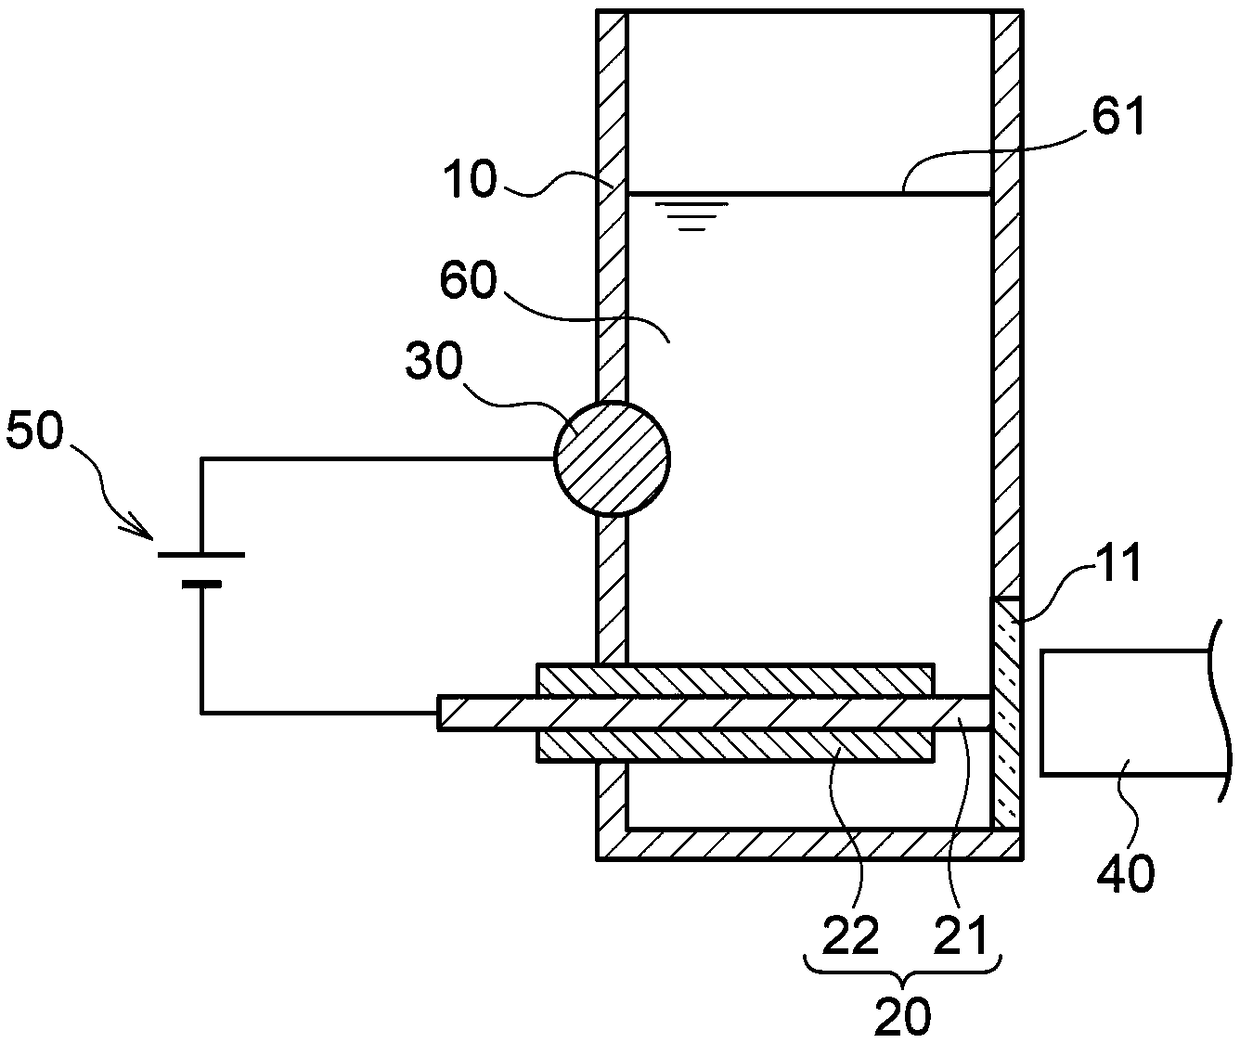
A plasma spectroscopy analysis method is provided which can suppress deviation of the luminescence amount of plasma luminescence caused by thallium that is a contrast metal component and an endogenicsubstance during detection of lead or mercury in a urine sample. A urine sample assumed to contain mercury or lead is diluted, and then a known concentration of thallium is added to the diluted urinesample. The resulting mixture is introduced to a measurement container, and an electric current is applied across a pair of electrodes in the measurement container such that the mercury or lead and the thallium in the urine sample are concentrated in a vicinity of one of the electrodes. An electric current is then applied across the pair of electrodes to generate plasma, and emitted light from themercury or lead and the thallium is detected. According to the luminescence spectrum obtained during detection, an analysis emission amount that is a net emission amount at an analysis wavelength that is a wavelength corresponding to the mercury or lead is corrected using a control emission amount that is a net emission amount at a control wavelength that is a wavelength corresponding to the thallium. The corrected value is compared to a calibration curve obtained by advance measurements of known concentrations of the mercury or lead in order to quantify the mercury or lead in the urine sample.
Description
technical field [0001] The present invention relates to a method for quantifying mercury or lead in a urine sample by concentration on an electrode and plasma luminescence by elution. Background technique [0002] As shown in Japanese Unexamined Patent Publication No. 2016-130734, it discloses the following method: the heavy metal ions in the sample are concentrated on the electrode by stripping, and then a large current is applied to generate plasma luminescence from the heavy metal ions, and the Quantify the heavy metal ions in the sample by using the amount of luminescence. [0003] Depending on the nature and state of the sample, the amount of light emitted from the plasma light emitted by heavy metal ions of the same concentration may vary. There is a possibility that the accuracy of quantification may be impaired due to the variation in the amount of luminescence. [0004] In particular, regarding urine samples, the variation in the amount of luminescence is presumab...
Claims
Login to View More Application Information
Patent Timeline
 Patent Type & AuthorityApplications(China)
IPC IPC(8): G01N21/66G01N21/67
CPCG01N21/66G01N21/67G01N21/69G01N33/493G01N21/73G01J3/443G01N1/38G01N21/25
Inventor桐山健太郎
OwnerARKRAY INC