A method for detecting abnormal behavior of electricity consumption of consumers based on isolated forests

A detection method and technology for electrical anomalies, which are applied in data processing applications, electrical digital data processing, digital data information retrieval, etc., can solve the problems of large subsequent operations and long running time of analysis and computing, so as to improve computing speed and reduce computing data. , to avoid the effect of the crash phenomenon

Active Publication Date: 2019-02-05
CHONGQING UNIV
View PDF4 Cites 37 Cited by
  • Summary
  • Abstract
  • Description
  • Claims
  • Application Information

AI Technical Summary

Problems solved by technology

[0005] The present invention provides a method for detecting abnormal electricity consumption behavior of users based on an isolated forest, and solv

Method used


Image

  • A method for detecting abnormal behavior of electricity consumption of consumers based on isolated forests
  • A method for detecting abnormal behavior of electricity consumption of consumers based on isolated forests
  • A method for detecting abnormal behavior of electricity consumption of consumers based on isolated forests

Examples


Embodiment 1

[0033] A method for detecting abnormal power consumption behavior of users based on isolated forest, comprising the following steps:

[0034] S1. Obtain power consumption time series data through data collection;

[0035] S2. Clean the data to remove incomplete data, wrong data, and duplicate data;

[0036] S3, feature extraction based on statistics:

[0037] S31. Data definition: S311. Let the data set be X={x n}, n ranges from 1 to N, the data set contains N daily electricity users, and each user is divided into D days, M months, and Q quarters of electricity consumption data; S312, the daily electricity consumption sequence of each user: x n ={x nd}, d ranges from 1 to D; S313, the monthly power consumption sequence of each user: y n ={y nm}, m takes 1 to M, S114. Quarterly power consumption sequence of each user: z n ={z nq}, q takes 1 to Q,

[0038] S32. Divide the user's electricity consumption behavior characteristics in units of year, quarter, and month in...

Embodiment 2

[0113] The only difference between this embodiment and Embodiment 1 is that this embodiment only changes the preprocessing model on the basis of Embodiment 1, and this embodiment uses an automatic encoder.

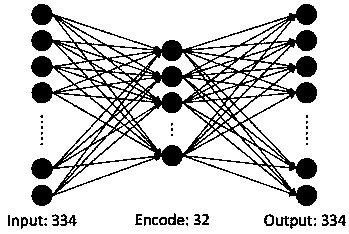
[0114] First, build a traditional single hidden layer autoencoder model, which is a fully connected neural network, such as figure 2 shown.

[0115] figure 2 In , the first half of the model is used as the automatic encoding part, and the second half is used as the automatic decoding part. The model takes the 334 feature dimensions cleaned from the original data as input and output at the same time, that is, the number of neurons in the input layer is the same as the number of neurons in the output layer. Here, the number of nodes in the middle layer is set to 32, which is less than the number of nodes in the input layer and output layer, which plays the role of data compression.

[0116] Next, configure the relevant parameters for the autoencoder model. Among them, ...

Embodiment 3

[0124] The difference between this embodiment and Embodiment 2 is that this embodiment only adds a hidden layer to the automatic encoder on the basis of Embodiment 2.

[0125] The previous autoencoder data processing model only established a single hidden layer. This time, a deeper autoencoder model was established for the data to be processed. The network structure is as follows: Figure 5 Shown:

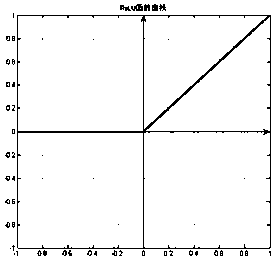
[0126] The basic configuration parameters are the same as the previous model configuration. The training optimization function of the configuration model is adadelta, the loss function is binary_crossentropy, the number of training is 100 times, and the activation function of the middle encoding layer and decoding layer uses the ReLU activation function. The software algorithm such as Figure 7 shown.


PUM


Abstract

The invention provides a method for detecting abnormal behavior of power consumption of users based on isolated forest, which comprises the following steps: S1, obtaining power consumption sequence data through data acquisition mode; 2, clean that data to remove incomplete data, incorrect data and duplicate data; S3, feature extraction based on statistics; S4, data preprocessing; 5, normalize thatmatrix YM *K to obtain a new matrix YM *K '; 6, judging whether that power consumption is abnormal or normal by using an isolated forest model; S61, extracting from a new matrix YM *K, each us extracts. Psi. Statistical characteristics, and assuming that the number t of iTree trees, yij, is the element of the i-th row and the j-th column in the new matrix YM *K; S62, calculating an abnormal scores (yij,. Psi.) of yij; S63, determining whether s (yij,. Psi.) is less than 1-Delta e, Delta e is a constant in the range of 0.22 to 0.07; If so, it is abnormal power consumption; If not, the electricity is normally used. An isolated forest-based user abnormal behavior detection method solves the problem of long running time of analysis and calculation caused by large subsequent operation due tolack of data processing in the prior art.

Description

technical field [0001] The invention relates to the field of electricity consumption monitoring, in particular to a method for detecting abnormal electricity consumption behavior of users based on an isolated forest. Background technique [0002] The earlier abnormal monitoring method of electricity consumption is to determine each abnormal indicator of electricity consumption, determine the threshold value of each abnormal indicator, and assign different weight scores to each abnormal indicator, and calculate the suspicion coefficient of electricity theft for each user after accumulation. Generally speaking, abnormal electricity consumption indicators can be divided into two types: line loss abnormality and instantaneous quantity abnormality. Based on these anomalies, a electricity stealing identification model is designed, and electricity stealing users are identified by calculating the suspect coefficient. [0003] However, for the detection of such equipment failures an...

Claims


Application Information

Patent Timeline
IPC IPC(8): G06F16/2458G06F16/215G06Q50/06
CPCG06Q50/06Y02D10/00
Inventor 张程曹宇佳田野杨璨宇古平陈自郁陈柯芯
Owner CHONGQING UNIV
Why Eureka
Try Eureka