Industrial data nonlinear cause and effect analysis method based on sparse deep neural network

A deep neural network and industrial data technology, applied in the field of fault diagnosis in industrial control systems, can solve the problems of only detecting linear causality and low calculation efficiency, so as to improve algorithm efficiency, reduce the number of inspections, and reduce the number of tests Effect

Active Publication Date: 2019-03-01
ZHONGDIAN HUACHUANG ELECTRIC POWER TECH RES
View PDF8 Cites 15 Cited by
  • Summary
  • Abstract
  • Description
  • Claims
  • Application Information

AI Technical Summary

Problems solved by technology

[0008] The invention provides a non-linear causal analysis method for industrial data based on a sparse deep neural network, which overcomes the disadvantages of low computational efficiency of traditional Granger causal analysis and can only detect linear causality, and can complete the inspection of non-linear causality , and only need to obtain routine operation data, no knowledge of process mechanism is required

Method used


Image

  • Industrial data nonlinear cause and effect analysis method based on sparse deep neural network
  • Industrial data nonlinear cause and effect analysis method based on sparse deep neural network
  • Industrial data nonlinear cause and effect analysis method based on sparse deep neural network

Examples


Embodiment Construction

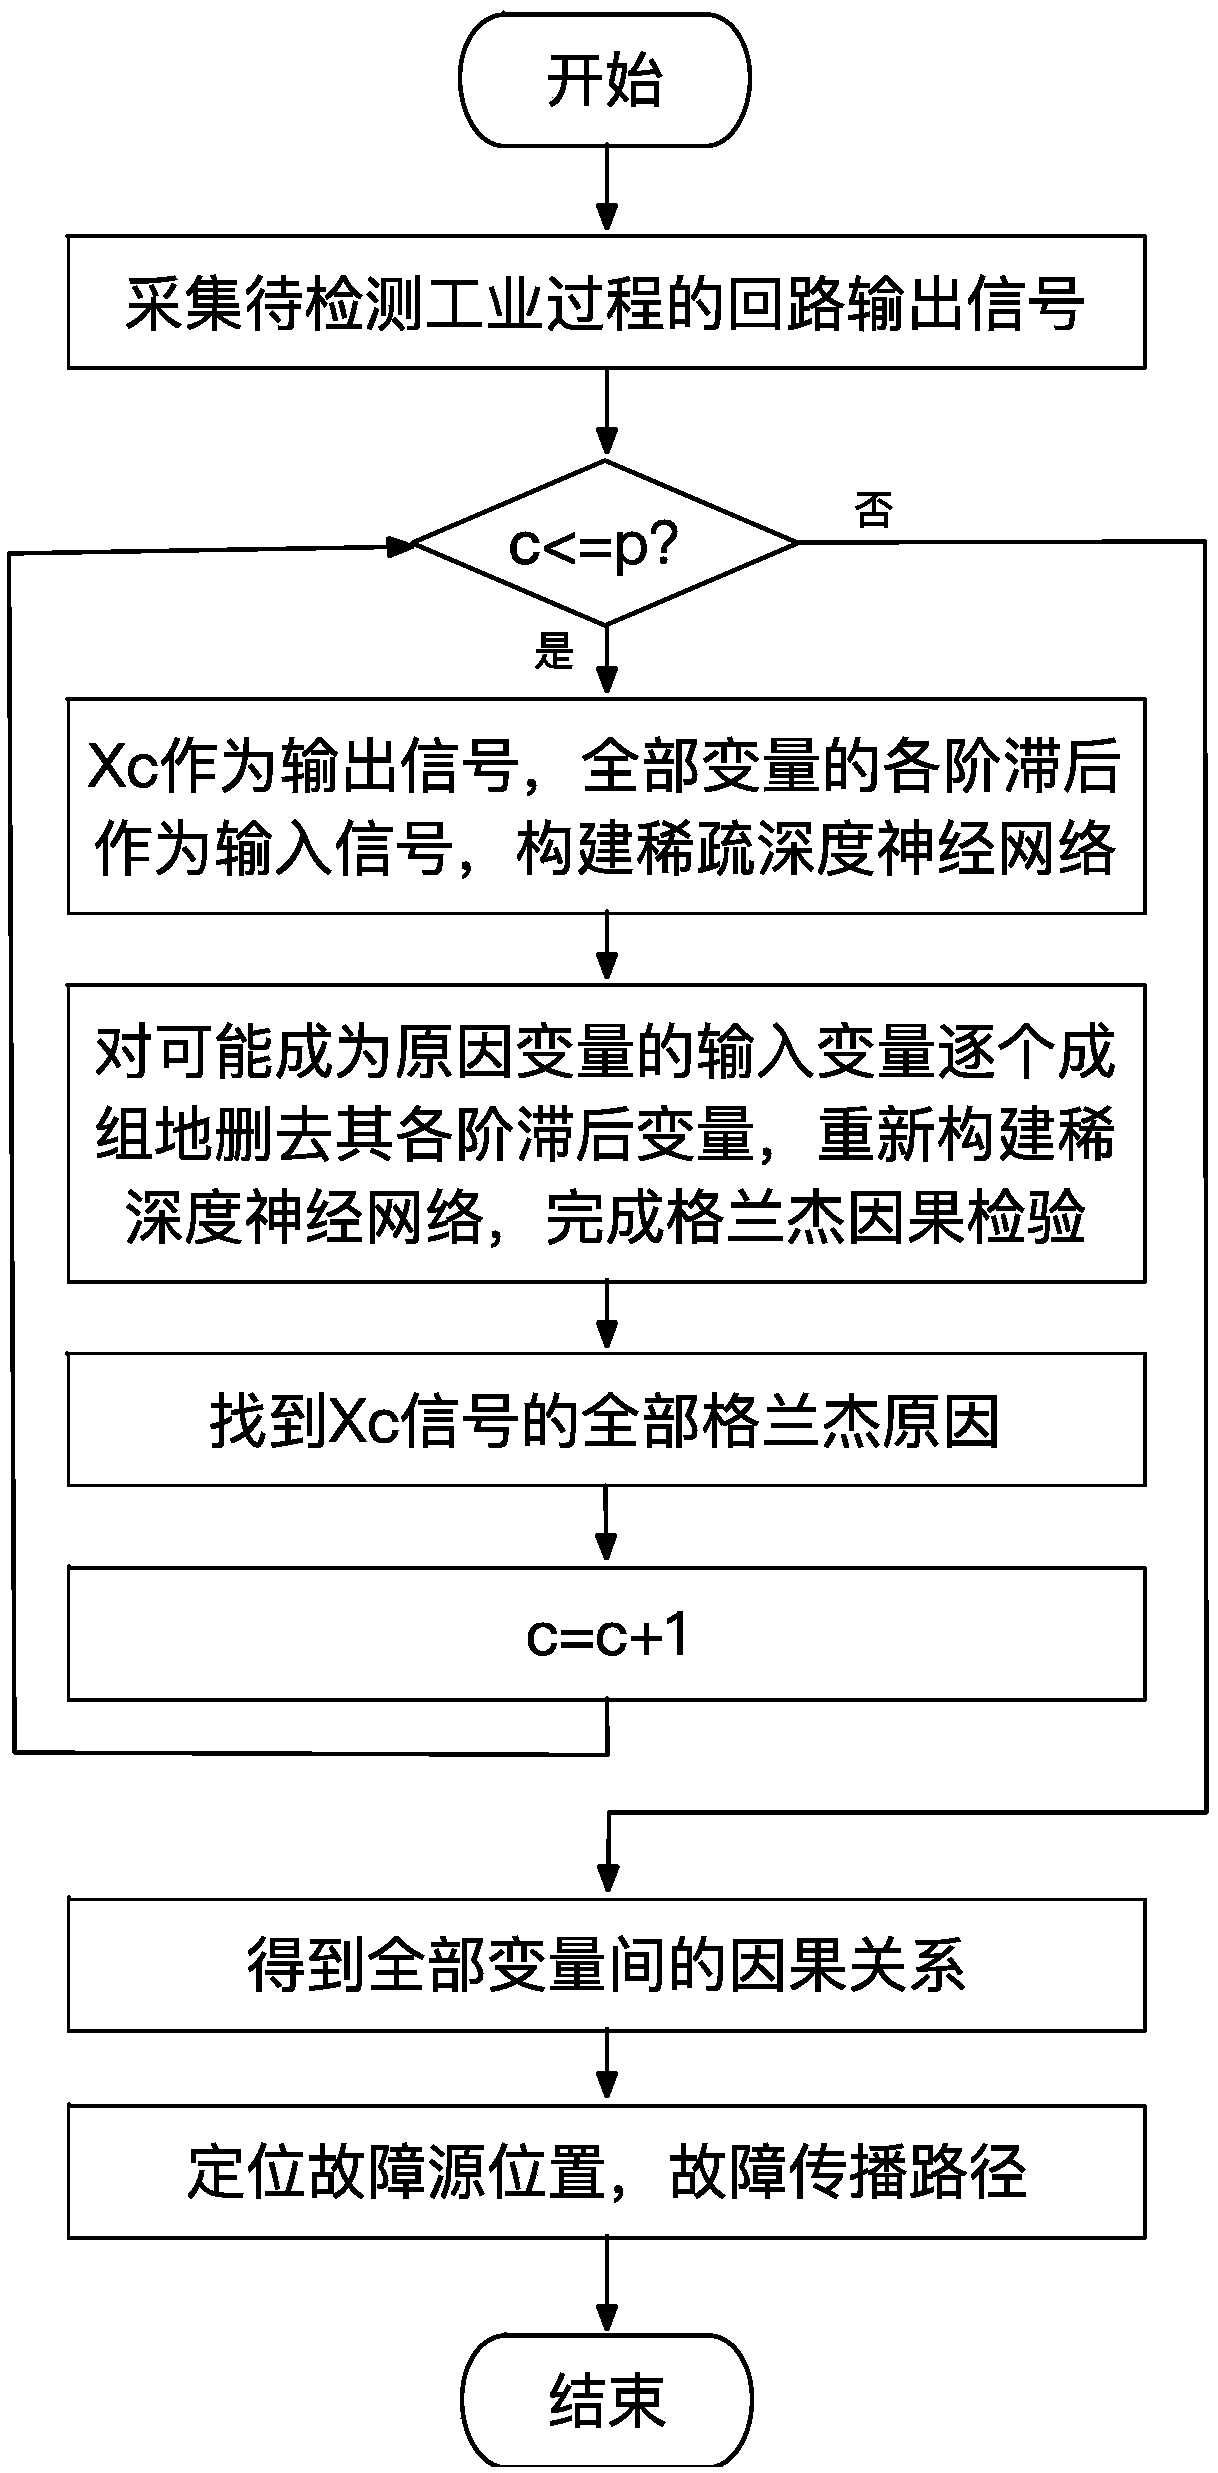
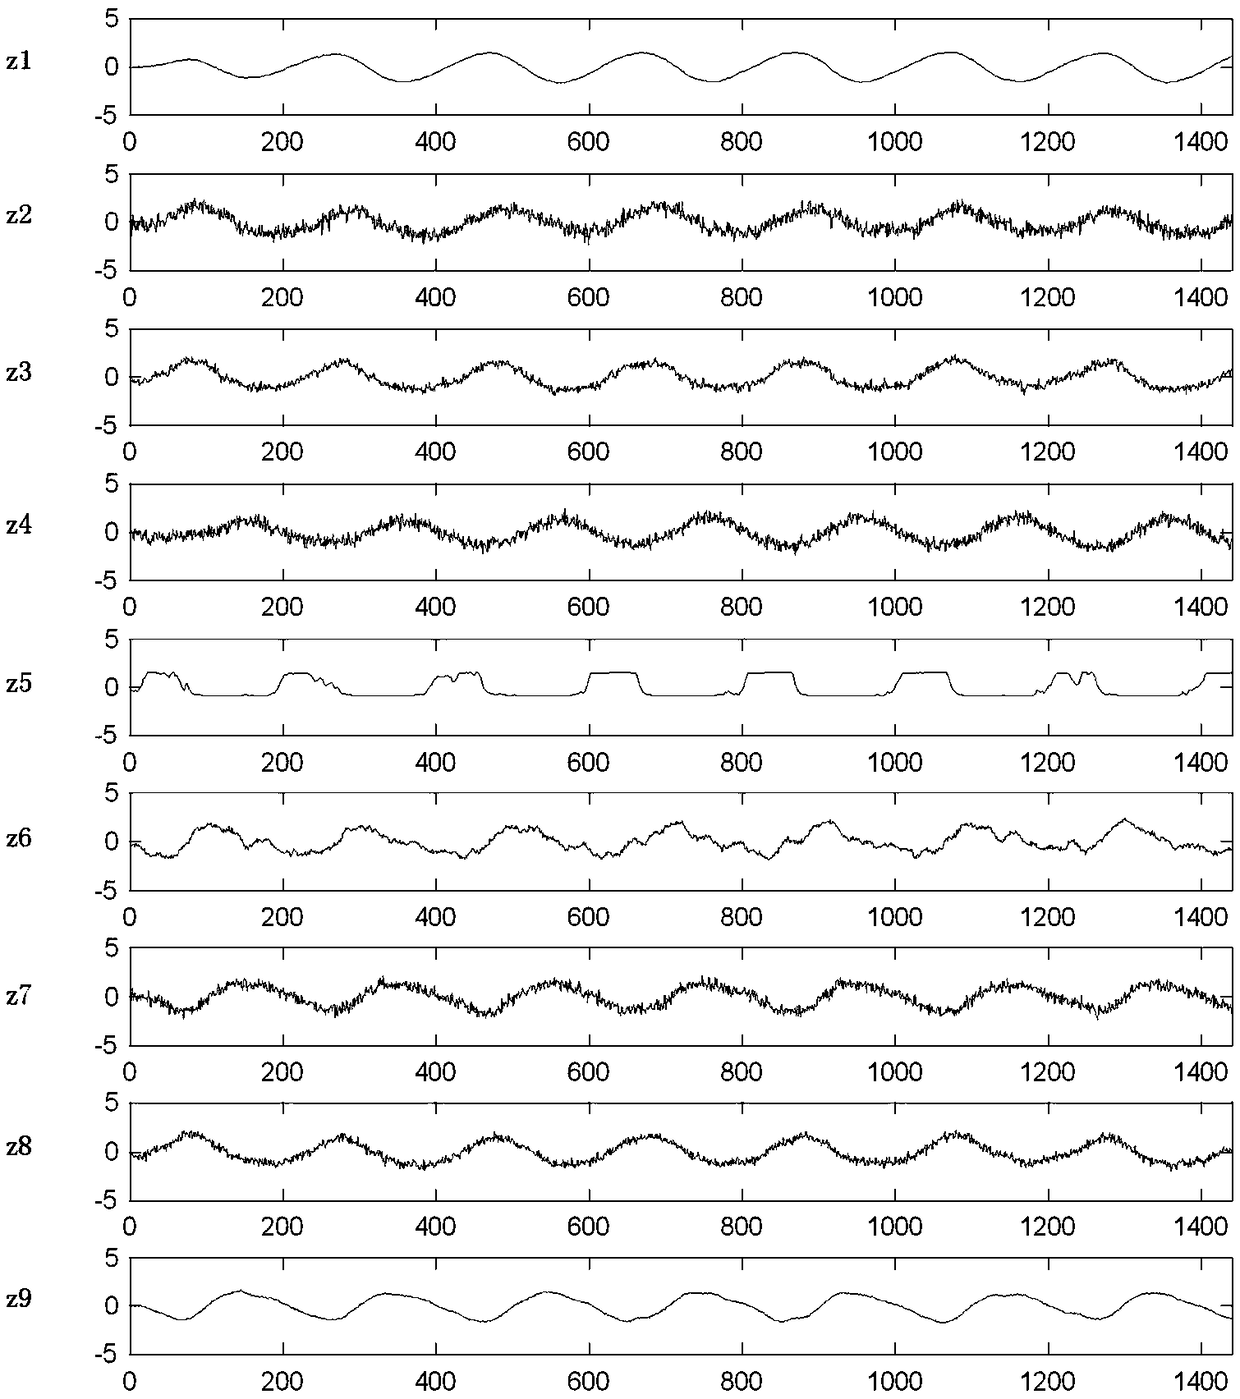
[0061] Taking the causal analysis of TE process simulation data as an example, the method of nonlinear causal analysis using sparse neural network is described in detail for the process data with continuous plant-level oscillation in each loop. It should be pointed out that the following examples are intended to facilitate the understanding of the present invention, but do not limit it in any way.

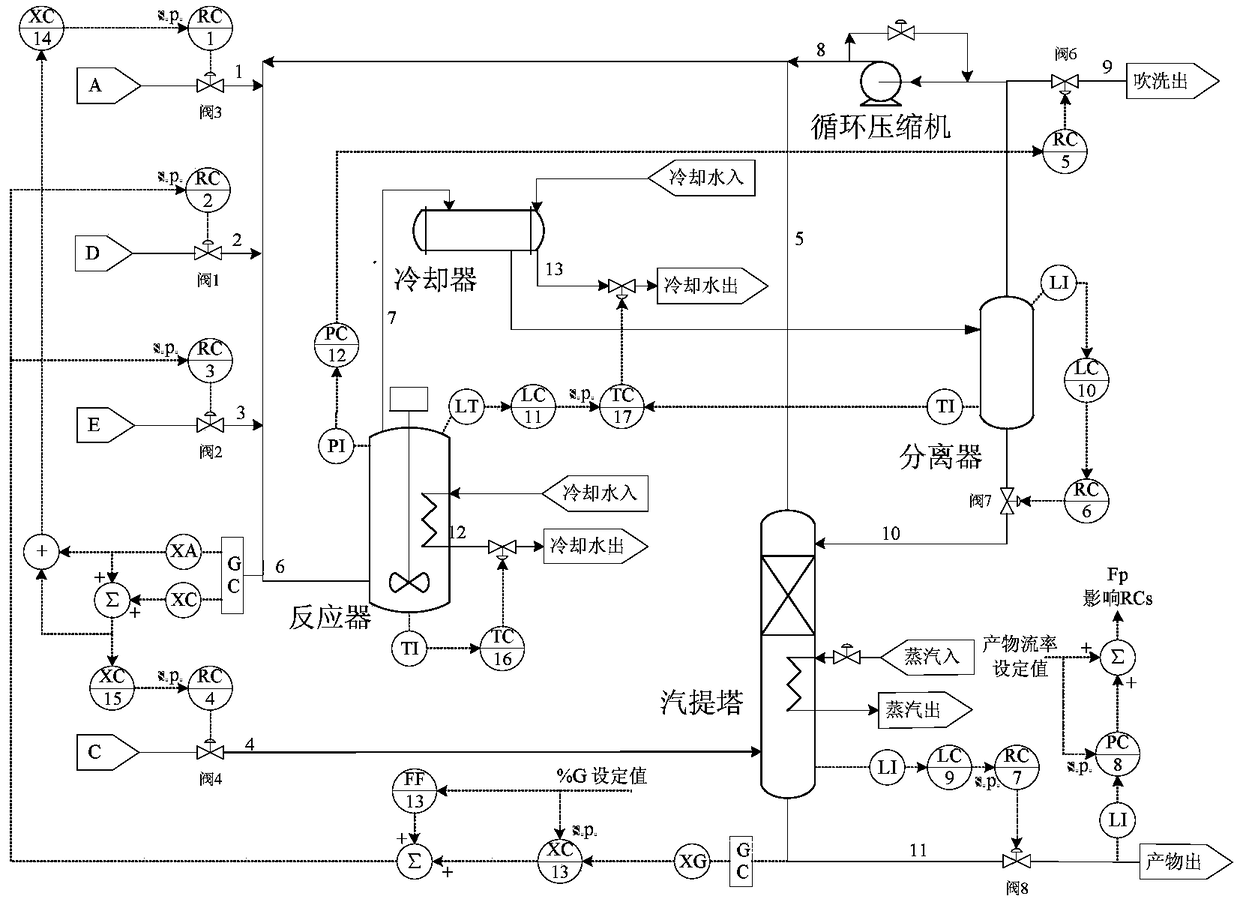
[0062] In the TE process, there are 41 measured variables including measurement noise and 12 manipulated variables (11 valve flow signals and reactor stirring rate signals). The main control objectives include: product flow rate, G component content in the product stream, reactor pressure, reactor liquid level, separator liquid level, stripper liquid level, etc. are kept at the set value. The control strategies of its 19 control loops are as follows: figure 1 And shown in Table 1.

[0063] Table 1

[0064]

[0065]

[0066] Among them, the 18th and 19th control loops are o...


PUM


Abstract

The invention discloses an industrial data nonlinear cause and effect analysis method based on a sparse deep neural network. The method comprises the following steps of (1) collecting the process output signals of all control loops in an industrial process to be detected; (2) selecting one process output signal as an output variable and taking each order lag of all variables as an input variable to construct the sparse deep neural network; (3) through successively deleting the input variables, completing Granger causality testing one by one, and acquiring all the Granger causes of the output signal of the process; (4) repeating the steps (2) and (3), and acquiring a causal relationship among the output signals of all the process; and (5) integrating the causal relationship among the outputsignals of all the process, and positioning a fault source location and fault propagation path. In the invention, nonlinear causal analysis can be performed on the control loop signal of the industrial process, and fault source positioning and fault propagation path analysis are completed.

Description

technical field [0001] The invention belongs to the field of fault diagnosis in industrial control systems, and in particular relates to a non-linear causal analysis method for industrial data based on a sparse deep neural network. Background technique [0002] The modern industrial process is composed of hundreds of highly coupled control loops, and its process equipment has the characteristics of large scale, many variables, high comprehensiveness and long-term operation under closed-loop control. Therefore, the actual control performance of each loop is closely related to the quality of industrial production, energy consumption, and operational safety, and is also the basis for upper-level optimization, scheduling, and management. However, due to over-tuning of the controller in the control loop, nonlinearity of the process, valve viscosity, external disturbance and model mismatch, only one-third of the loops meet the control performance requirements in actual operation, ...

Claims


Application Information

Patent Timeline
Patent Type & Authority Applications(China)
IPC IPC(8): G05B23/02
CPCG05B23/0243G05B2219/24065
Inventor 谢磊乔丹苏宏业
Owner ZHONGDIAN HUACHUANG ELECTRIC POWER TECH RES
Why Eureka
Try Eureka