Method for determining typical daily load curve by using comprehensive energy system energy consumption big data

A technology that integrates energy systems and load curves, which is applied in the field of energy management to ensure accuracy, good clustering results, and low time complexity.

Pending Publication Date: 2019-10-01
SHANGHAI UNIVERSITY OF ELECTRIC POWER +1
View PDF3 Cites 5 Cited by
  • Summary
  • Abstract
  • Description
  • Claims
  • Application Information

AI Technical Summary

Problems solved by technology

[0005] The present invention aims at the problem of rational utilization of energy, and proposes a method for determining typical daily load curves by using large energy consumption data of the

Method used


Image

  • Method for determining typical daily load curve by using comprehensive energy system energy consumption big data
  • Method for determining typical daily load curve by using comprehensive energy system energy consumption big data
  • Method for determining typical daily load curve by using comprehensive energy system energy consumption big data

Examples


Embodiment Construction

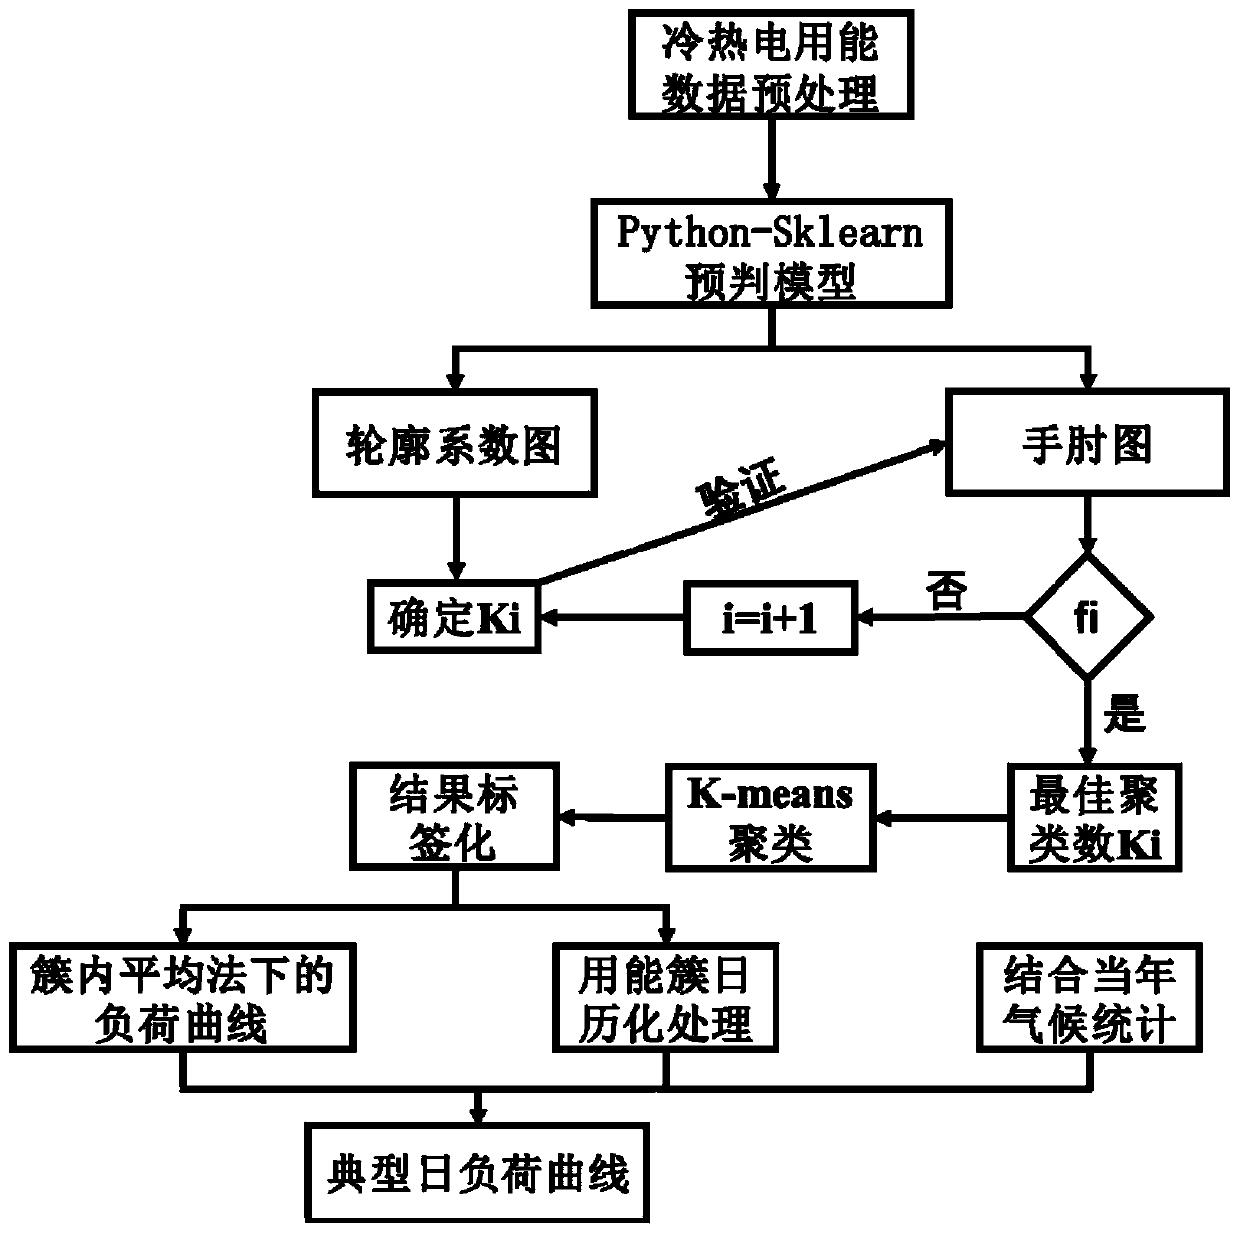
[0028] In this embodiment, the raw data is further processed on the basis of the traditional energy consumption analysis of the integrated energy system. Using the SKLEARN module in PYTHON to program, cluster analysis and processing of energy use data, determine the optimal number of clusters and perform K-means clustering, so as to analyze the characteristics of energy use and determine the typical daily load curve.

[0029] Such as figure 1 The flow chart of the analysis of energy consumption characteristics and the implementation of the energy load forecasting method for the applicable integrated energy system is shown.

[0030] Standardize the 96-point data of the annual power load of a company or region in a certain year (take the power load as an example, the method is also applicable to cold and heat loads, and 96 points means dividing each day into 96 moments), And eliminate the abnormal data due to maintenance, meter failure and other reasons, and put the sorted data...


PUM


Abstract

The invention relates to a method for determining a typical daily load curve by using comprehensive energy system energy consumption big data. According to the method, the original energy consumptionhistorical data is subjected to standardized preprocessing, so that the influence caused by large order-of-magnitude difference of data participating in clustering analysis is eliminated, abnormal data generated by human and other non-resistance factors are eliminated, and the accuracy and reasonability of a result are ensured. The optimal clustering number is determined by adopting a double-indexmutual verification method of a contour coefficient method SILHOUETTE index and an elbow method SSE index, so that the phenomenon of non-optimal result caused by self-calculation characteristics of asingle index is avoided. Compared with a typical daily load curve selected by a traditional peak load-apportionment proportional method, the method for solving the typical daily load by using the data averaging processing in the classification cluster has the advantages that the classification characteristics of the obtained energy consumption data are closer to the actual energy consumption demand characteristics, and the load prediction is more representative.

Description

technical field [0001] The invention relates to an energy management technology, in particular to a method for determining a typical daily load curve by utilizing large energy consumption data of an integrated energy system. Background technique [0002] With the rapid development of social economy, the increasing level of industrial production and consumption of residents, the demand for energy is increasing day by day, and has caused large-scale regional and global environmental problems. In order to solve the increasingly severe energy and environmental dilemma, developed countries such as the United States, Japan and Europe proposed a comprehensive energy system development plan at the beginning of this century, with the purpose of promoting the popularization and application of distributed energy and increasing the penetration ratio of clean energy. [0003] The three-dimensional structure of the integrated energy system makes the integrated energy system reflect its in...

Claims


Application Information

Patent Timeline
IPC IPC(8): G06Q10/06G06Q50/06G06K9/62
CPCG06Q10/063G06Q10/06393G06Q10/067G06Q50/06G06F18/23213
Inventor 郭帅任洪波吴琼皇甫艺
Owner SHANGHAI UNIVERSITY OF ELECTRIC POWER
Why Eureka
Try Eureka