

Prediction method for demand side heat supply load
A forecasting method and load forecasting technology, applied in forecasting, instrumentation, marketing, etc., can solve the problems of poor forecasting accuracy, unfavorable scheduling optimization, large forecasting deviation, etc., to solve the problem of low accuracy, improve accuracy, and reduce forecasting The effect of bias
- Summary
- Abstract
- Description
- Claims
- Application Information
AI Technical Summary
Problems solved by technology
Method used
Image

Examples
Embodiment 1
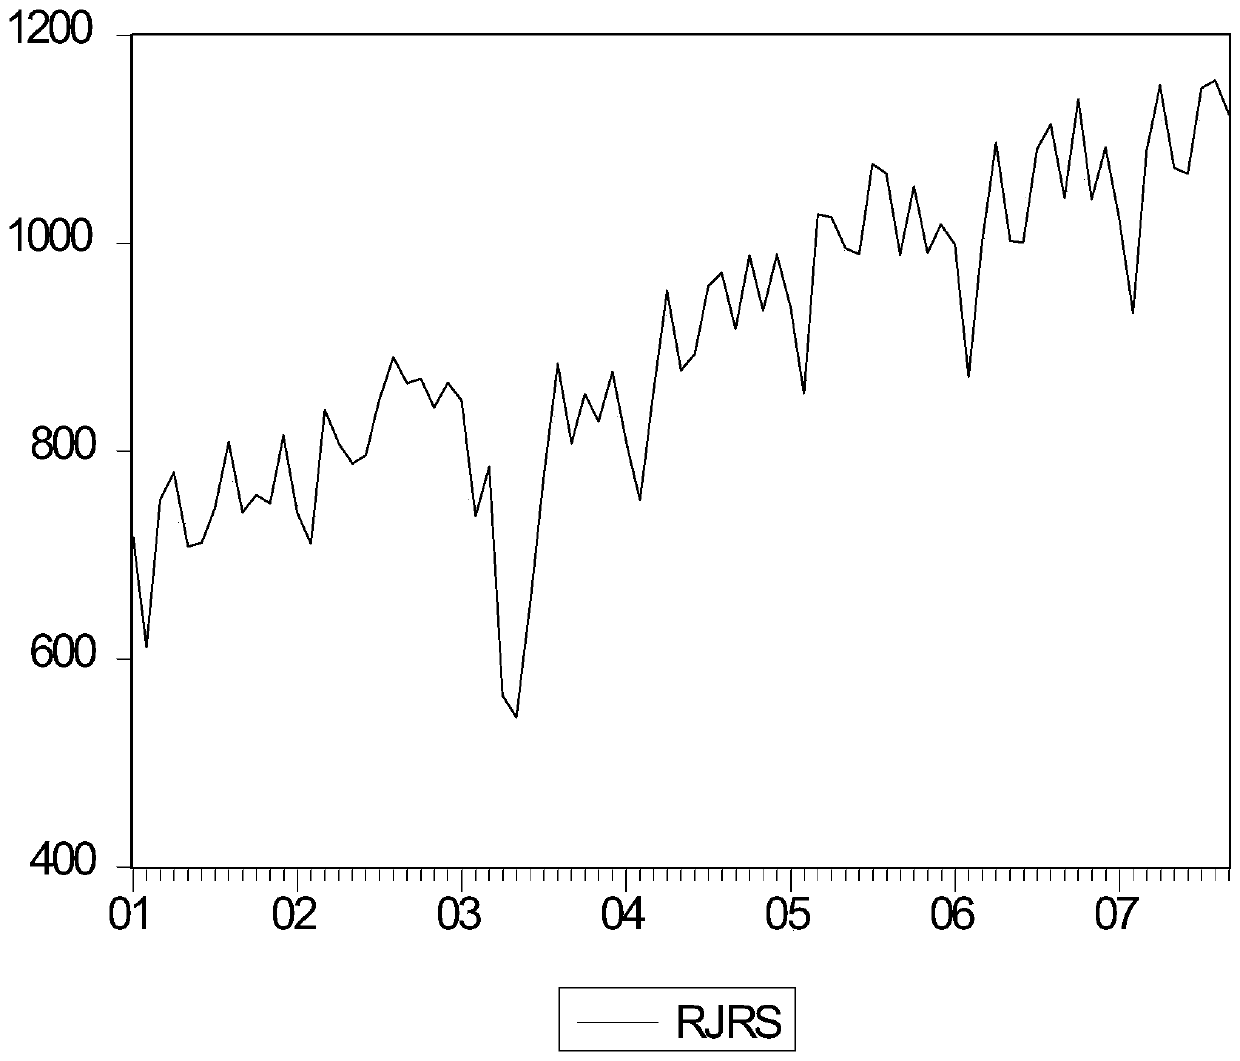
[0055] Provide the power values under the same heating area on November 15, November 30, December 15, December 30, January 15, and January 30 every year from 2007 to 2018, as shown in Table 1.
[0056] Table 1. Power value table under the same heating area from the beginning of November 2007 to the end of 2018 (unit: kWh)
[0057] time 2007 2008 2009 2010 2011 2012 2013 2014 2015 2016 2017 2018 November 15 717.38 611.6 753.26 779.7 707.87 711.8 745.4 809.1 741 758 750 815 November 30 740.7 711 839.54 807.77 787.92 795.8 849.4 890.7 865 870 842 866 December 15 848.43 737.6 785.13 564.92 543.83 652.6 776.9 884.4 808 855 828 877 December 30 808.73 753.3 855.16 954.71 877.47 893.4 959 971.6 917 988 935 990 January 15 938.06 855.1 1027.8 1024.8 995.14 989.4 1076 1067 989 1055 991 1018 January 30 998.85 871.4 1003 1097.1 1002.4 1000 1090 1115 1044 1138 1042 109...
PUM
 Abstract
Description
Claims
Application Information