Abnormal Analysis and Treatment of Line Loss Rate in Station Area

A processing method and line loss rate technology, applied in the field of electric power information, can solve the problems of not being able to determine the specific time period of power loss, measurement failure, and difficulty, so as to improve the level of line loss management in the same period, improve work efficiency, and reduce the scope of inspection. Effect

Active Publication Date: 2022-03-18
DANDONG ELECTRIC POWER SUPPLY COMPANY OF STATE GRID LIAONING ELECTRIC POWER SUPPLY +1
View PDF5 Cites 0 Cited by
  • Summary
  • Abstract
  • Description
  • Claims
  • Application Information

AI Technical Summary

Problems solved by technology

[0002] When dealing with abnormal line loss in the station area, the existing method has a single condition for judging the abnormal line loss rate during the meter reading cycle, that is, it only lists the percentage of power loss in the meter reading cycle to the power supply, and does not perform quantitative analysis on the power loss , it is impossible to clarify the specific time period of power loss, whether it is technical loss or management loss, whether it is measurement failure or artificial power theft, which makes it difficult and inefficient for line loss staff to deal with abnormal line loss in the low-voltage station area during the same period

Method used


Image

  • Abnormal Analysis and Treatment of Line Loss Rate in Station Area
  • Abnormal Analysis and Treatment of Line Loss Rate in Station Area
  • Abnormal Analysis and Treatment of Line Loss Rate in Station Area

Examples


Embodiment 1

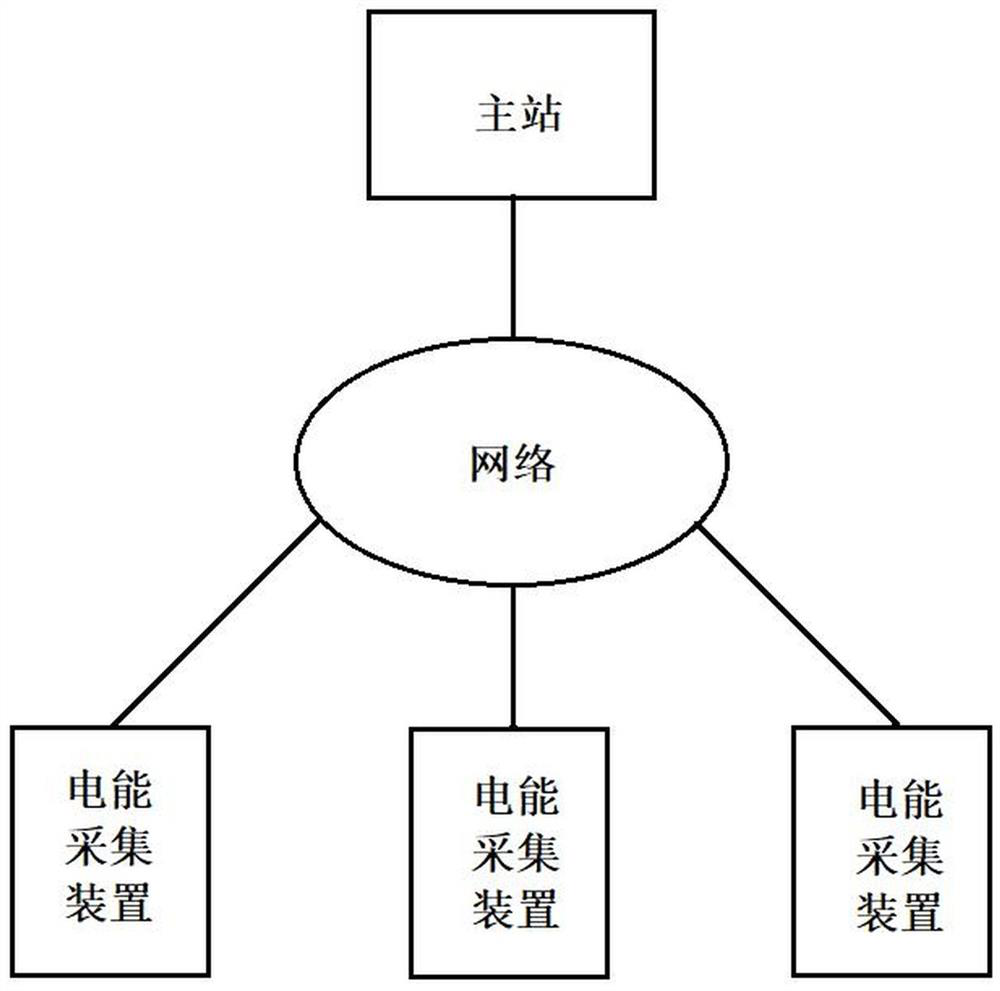
[0025] Such as figure 1 As shown, the electricity monitoring terminal freezes the data of all single-phase and three-phase smart meters in the station area during the meter reading cycle and transmits them to the server. The background analysis software analyzes the line loss in the station area by reading the server-side data and constructing the line loss analysis model, automatically screens all abnormal users in the station area, and provides processing basis for on-site investigators.

[0026] The line loss analysis model is divided into 9 items, which are peak and valley time-sharing line loss analysis model, voltage and current remote call measurement model, station area line loss longitudinal analysis model, station area line loss transverse model, station area section line loss Assessment model, zero household inspection model, zero fire simultaneous measurement model, three-phase load balance model, and voltage and current same-phase model.

Embodiment 2

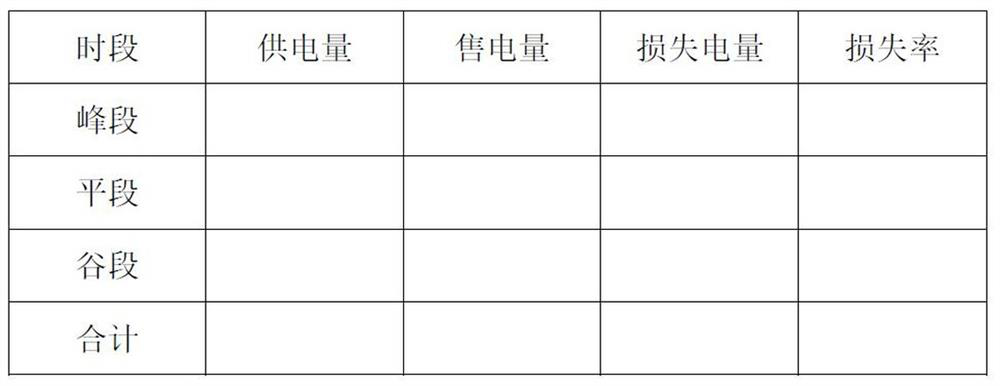
[0028] figure 2 is the peak-valley time-sharing line loss analysis model provided by the present invention, such as figure 2 The active power indications of all electric energy meters in the station area recalled by the terminal of the data acquisition equipment shown in the peak, valley, and flat periods are calculated using the line loss rate calculation method to create a peak-valley time-sharing line loss analysis model, and according to the calculated losses in each period Electricity and loss rate, analyze the fluctuation of line loss rate in each period of the station area, and determine the time of power loss;

Embodiment 3

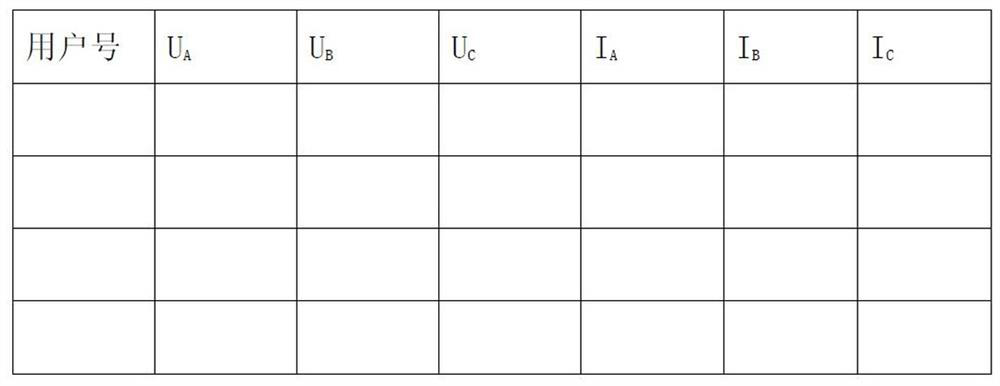
[0030] image 3 It is the voltage and current remote call measurement model provided by the present invention, such as image 3 As shown, the abnormal data is analyzed on the records of user voltage and current collected by the terminal of the data acquisition equipment.

[0031] The analysis is as follows: if the measured voltage value is 380-400 volts, the zero line and the live wire are reversed, if the measured voltage value is 0 volts, the electric energy meter loses voltage; if the measured current is negative, the incoming and outgoing lines are reversed, If the neutral wire current is greater than the live wire current, the neutral and live wires are reversed or steal electricity.


PUM


Abstract

The abnormal analysis and processing method of the line loss rate in the station area includes the following steps: Step 1, the data acquisition equipment terminal is based on the power carrier principle, and is installed at the lower end of the concentrator on the low-voltage side of the public transformer station area; Step 2, the electricity monitoring terminal freezes the meter reading cycle The data of all single-phase and three-phase smart meters in the inner station area are transmitted to the server; step 3, the background analysis software reads the server-side data and builds a line loss analysis model to analyze the line loss in the station area and automatically Screen all abnormal users in the station area to provide processing basis for on-site investigators. This method quantifies the power loss in the station area, defines the time period of power loss in the meter reading cycle, and clarifies whether it is a technical loss or a management loss, whether it is a measurement failure or artificial power theft. The inspection scope of the line loss staff is reduced, the workload is greatly reduced, and the work efficiency and the level of line loss management in the same period are improved.

Description

technical field [0001] The invention belongs to the technical field of electric power information, and in particular relates to an analysis and processing method for an abnormal line loss rate in a station area. Background technique [0002] When dealing with abnormal line loss in the station area, the existing method has a single condition for judging the abnormal line loss rate during the meter reading cycle, that is, it only lists the percentage of power loss in the meter reading cycle to the power supply, and does not perform quantitative analysis on the power loss , It is impossible to clarify the specific time period of power loss, whether it is technical loss or management loss, whether it is measurement failure or artificial power theft, which makes it difficult and inefficient for line loss staff to deal with abnormal line loss in the low-voltage station area during the same period. Contents of the invention [0003] In order to solve the above-mentioned problems,...

Claims


Application Information

Patent Timeline
Patent Type & Authority Patents(China)
IPC IPC(8): G06Q50/06
CPCG01R31/00
Inventor 何立强何立刚赵允葛运清梅礼行曹传忠曹沐新张振华罗汉文孙延栋
Owner DANDONG ELECTRIC POWER SUPPLY COMPANY OF STATE GRID LIAONING ELECTRIC POWER SUPPLY
Why Eureka
Try Eureka